Monitoring etcd monitoring dashboards, metrics, and alert rules.
Dashboards The ETCD module provides one monitoring dashboard: Etcd Overview.
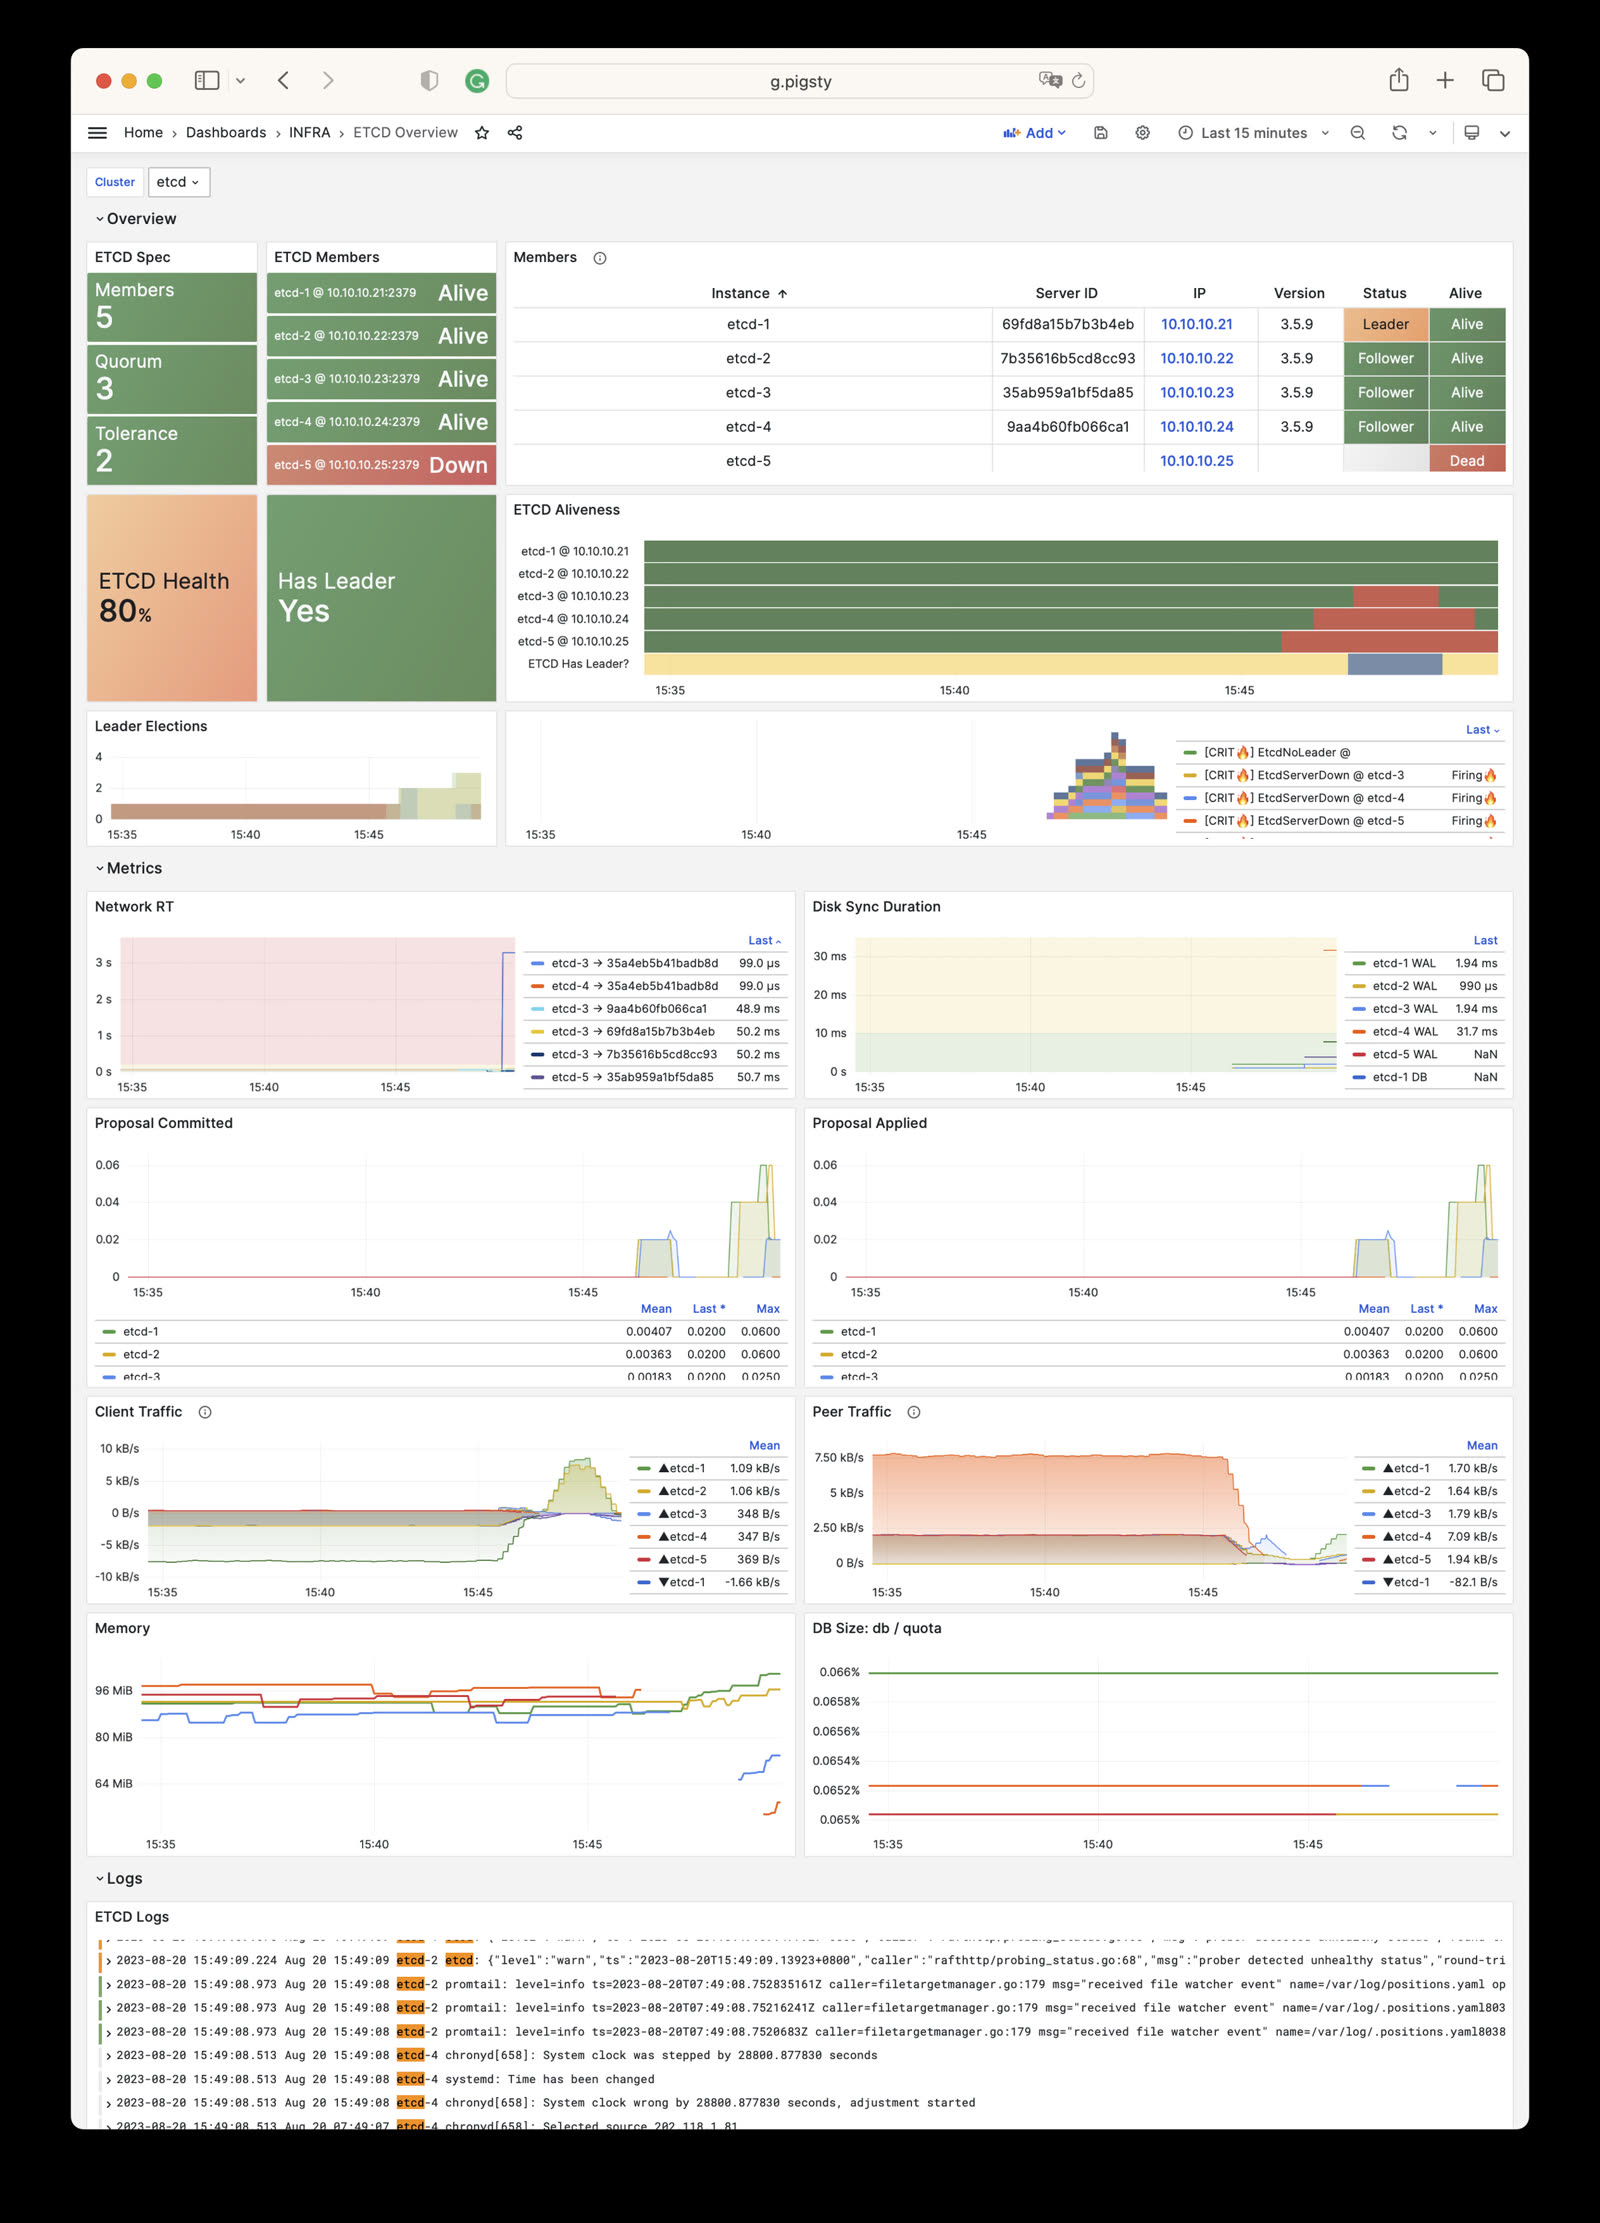
ETCD Overview Dashboard ETCD Overview : Overview of ETCD cluster
The dashboard shows key ETCD status information. The ETCD Aliveness panel shows the overall cluster service status.
Red bands indicate instance downtime. A blue-gray area below the bands indicates that the cluster is unavailable.
Alert Rules Pigsty provides five preset alert rules for etcd, defined in files/victoria/rules/etcd.yml
EtcdServerDown: etcd node down, CRIT alertEtcdNoLeader: etcd cluster no leader, CRIT alertEtcdQuotaFull: etcd quota > 90%, WARN alertEtcdNetworkPeerRTSlow: etcd network latency slow, INFO alertEtcdWalFsyncSlow: etcd disk fsync slow, INFO alertThe following excerpt matches the current rule source. Pigsty currently includes only the etcd-overview dashboard. Comments for the two latency alerts refer to /ui/d/etcd-instance, but these targets do not exist. Use /ui/d/etcd-overview to inspect cluster state. This known error in the source comments does not affect the alert expressions.
#==============================================================#
# Aliveness #
#==============================================================#
# etcd server instance down
- alert : EtcdServerDown
expr : etcd_up < 1
for : 1m
labels : { level : 0, severity : CRIT, category : etcd }
annotations :
summary : "CRIT EtcdServerDown {{ $labels.ins }}@{{ $labels.instance }}"
description : |
etcd_up[ins={{ $labels.ins }}, instance={{ $labels.instance }}] = {{ $value }} < 1
https://demo.pigsty.io/d/etcd-overview
#==============================================================#
# Error #
#==============================================================#
# Etcd no Leader triggers P0 alert immediately
# if dcs_failsafe mode not enabled, may cause global outage
- alert : EtcdNoLeader
expr : min(etcd_server_has_leader) by (cls) < 1
for : 15s
labels : { level : 0, severity : CRIT, category : etcd }
annotations :
summary : "CRIT EtcdNoLeader: {{ $labels.cls }} {{ $value }}"
description : |
etcd_server_has_leader[cls={{ $labels.cls }}] = {{ $value }} < 1
https://demo.pigsty.io/d/etcd-overview?from=now-5m&to=now&var-cls={{$labels.cls}}
#==============================================================#
# Saturation #
#==============================================================#
- alert : EtcdQuotaFull
expr : etcd:cls:quota_usage > 0.90
for : 1m
labels : { level : 1, severity : WARN, category : etcd }
annotations :
summary : "WARN EtcdQuotaFull: {{ $labels.cls }}"
description : |
etcd:cls:quota_usage[cls={{ $labels.cls }}] = {{ $value | printf "%.3f" }} > 90%
https://demo.pigsty.io/d/etcd-overview
#==============================================================#
# Latency #
#==============================================================#
# etcd network peer rt p95 > 200ms for 1m
- alert : EtcdNetworkPeerRTSlow
expr : etcd:ins:network_peer_rt_p95_5m > 0.200
for : 1m
labels : { level : 2, severity : INFO, category : etcd }
annotations :
summary : "INFO EtcdNetworkPeerRTSlow: {{ $labels.cls }} {{ $labels.ins }}"
description : |
etcd:ins:network_peer_rt_p95_5m[cls={{ $labels.cls }}, ins={{ $labels.ins }}] = {{ $value }} > 200ms
https://demo.pigsty.io/d/etcd-instance?from=now-10m&to=now&var-cls={{ $labels.cls }}
# Etcd wal fsync rt p95 > 50ms
- alert : EtcdWalFsyncSlow
expr : etcd:ins:wal_fsync_rt_p95_5m > 0.050
for : 1m
labels : { level : 2, severity : INFO, category : etcd }
annotations :
summary : "INFO EtcdWalFsyncSlow: {{ $labels.cls }} {{ $labels.ins }}"
description : |
etcd:ins:wal_fsync_rt_p95_5m[cls={{ $labels.cls }}, ins={{ $labels.ins }}] = {{ $value }} > 50ms
https://demo.pigsty.io/d/etcd-instance?from=now-10m&to=now&var-cls={{ $labels.cls }} Was this page helpful?
Yes
No
Thanks—your feedback helps us improve this page.
What got in the way? (optional)
Missing information
Incorrect or outdated
Steps did not work
Hard to understand
Change response