Monitoring
The FERRET module currently provides one monitoring dashboard.
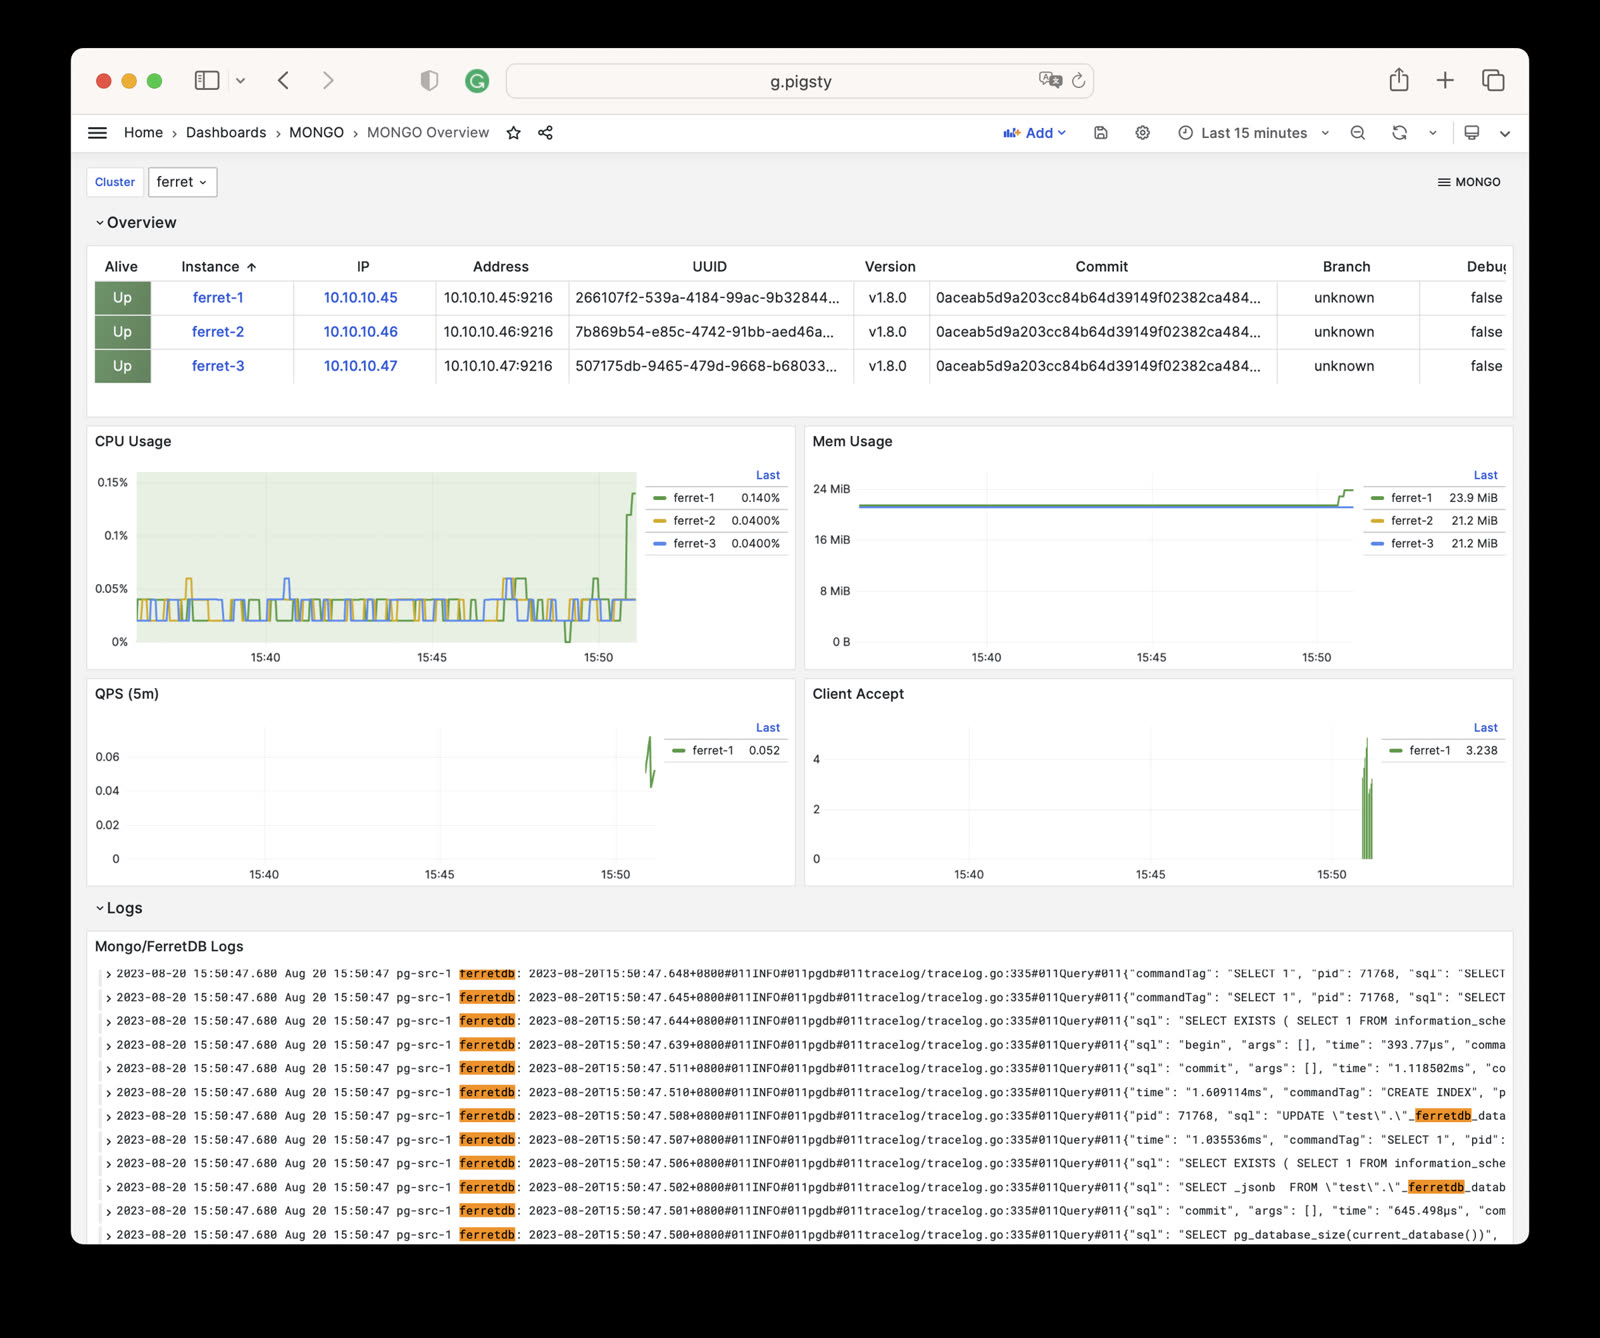
Mongo Overview
Mongo Overview: Mongo/FerretDB cluster overview
This dashboard provides basic monitoring metrics for FerretDB, including:
- Instance status: Running state of FerretDB instances
- Client connections: Client connection count and request statistics
- Resource usage: CPU, memory, goroutine count, etc.
- PostgreSQL connection pool: Backend PostgreSQL connection pool status
Since FerretDB uses PostgreSQL as its underlying storage engine, for more monitoring metrics please refer to PostgreSQL Monitoring.
Metrics
FerretDB exposes Prometheus-format metrics through its built-in exporter on the mongo_exporter_port (default 9216) port.
Key metric categories include:
| Metric Prefix | Description |
|---|---|
ferretdb_* | FerretDB core metrics |
ferretdb_client_* | Client connection and request stats |
ferretdb_postgresql_* | PostgreSQL backend status |
go_* | Go runtime metrics |
process_* | Process-level metrics |
For the complete list of metrics, see Metrics.
Alerting Rules
Pigsty v4.1 default rule sets (files/victoria/rules/*.yml) do not include dedicated FerretDB alerts out of the box. You can add custom alerts based on ferretdb_up, for example:
- alert: FerretDBDown
  expr: ferretdb_up == 0
  for: 1m
  labels:
    severity: critical
  annotations:
    summary: "FerretDB instance {{ $labels.ins }} is down"
    description: "FerretDB instance {{ $labels.ins }} on {{ $labels.ip }} has been down for more than 1 minute."
Since FerretDB is a stateless proxy layer, primary monitoring and alerting should focus on the underlying PostgreSQL cluster.
Feedback
Was this page helpful?
Thanks for the feedback! Please let us know how we can improve.
Sorry to hear that. Please let us know how we can improve.