Architecture
Architecture Overview
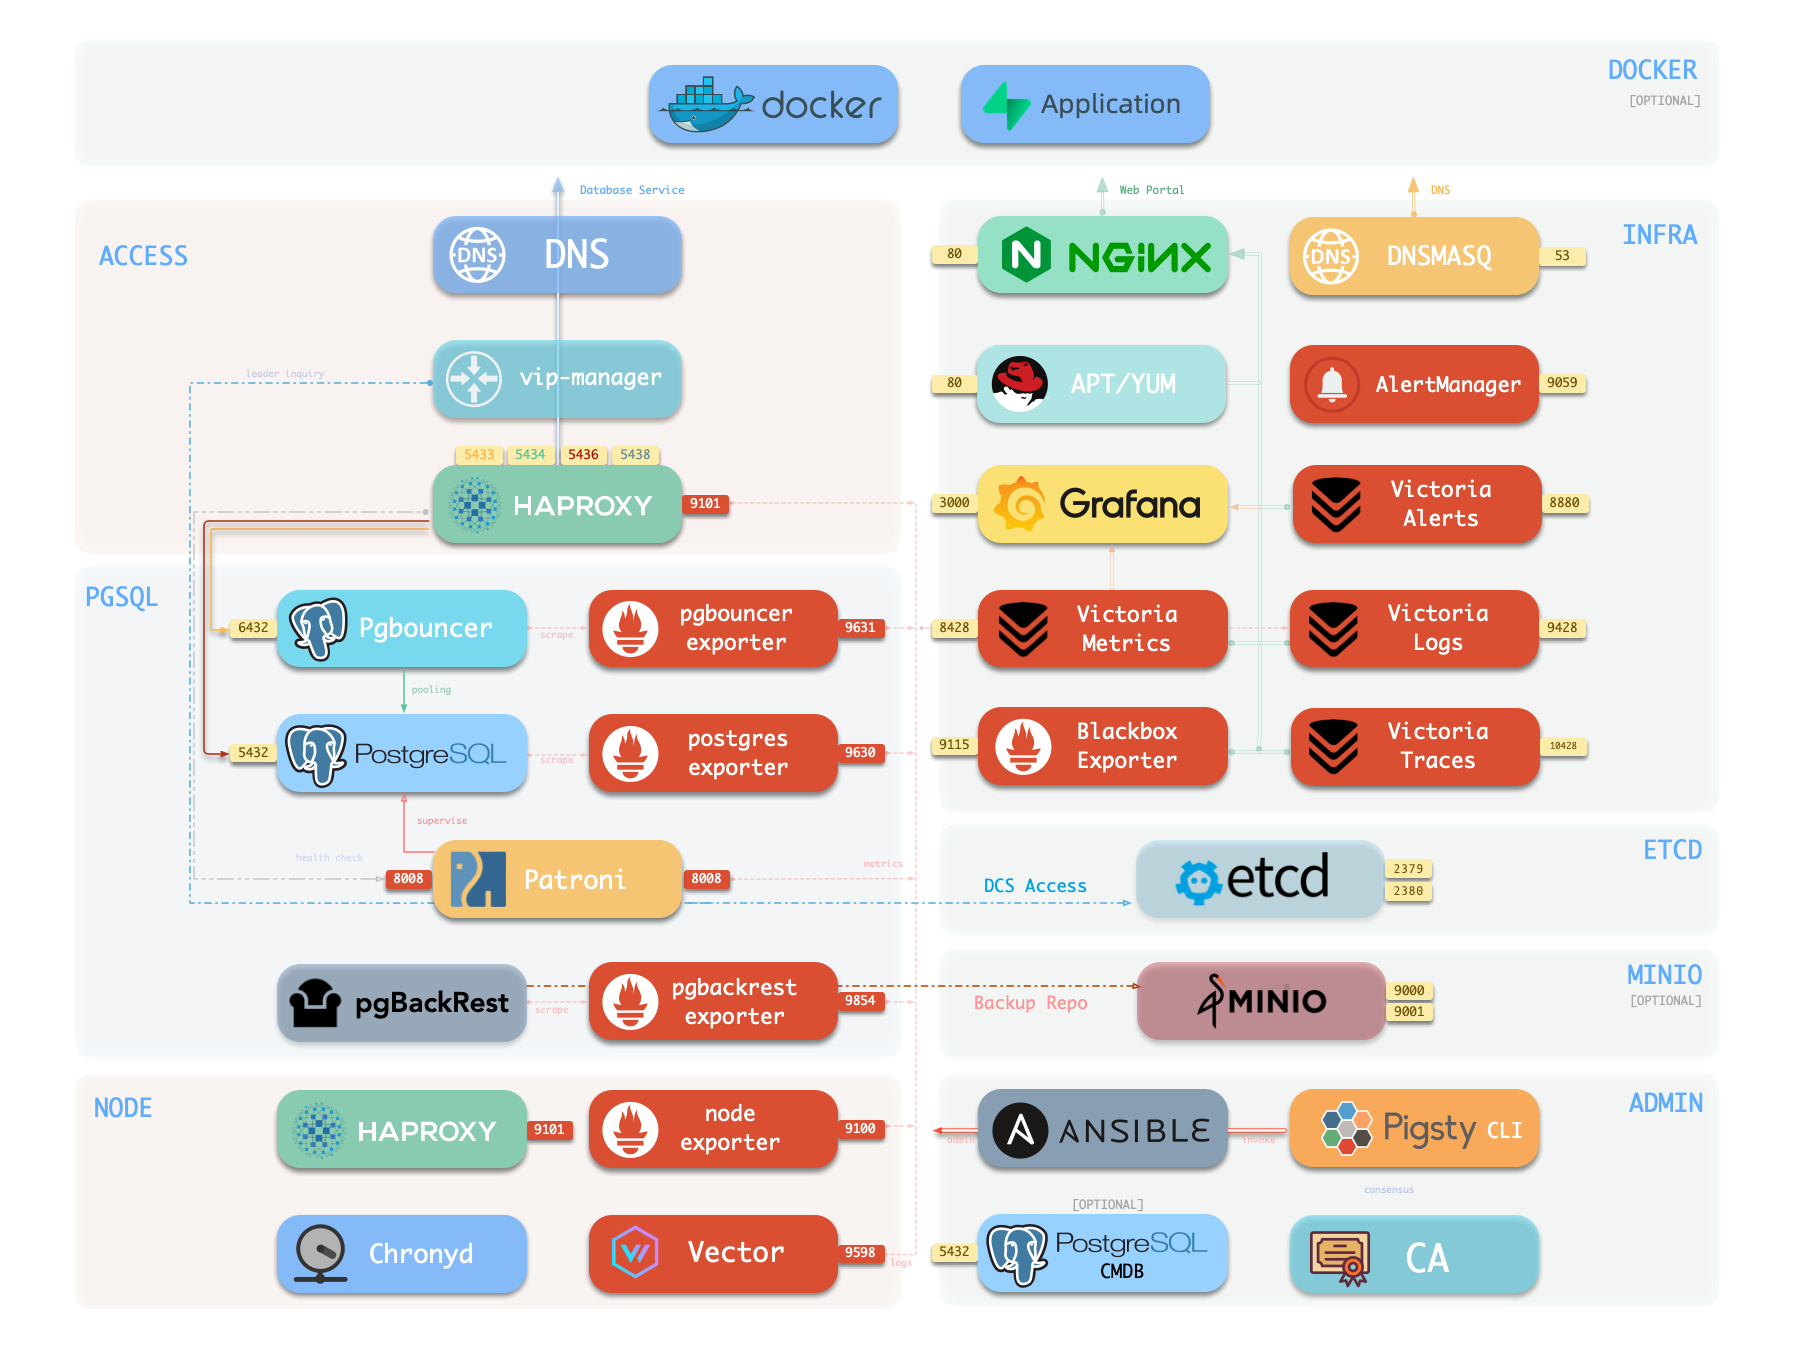
Standard Pigsty deployment includes an INFRA module that provides services for managed nodes and database clusters:
- Nginx: Web server providing local repo services; reverse proxy consolidates Grafana, VMUI, Alertmanager web UI access.
- Grafana: Visualization platform for monitoring metrics, logs, and tracing—hosts monitoring dashboards, inspection reports, and custom data apps.
- VictoriaMetrics Suite: Unified observability platform.
- VictoriaMetrics: Scrapes all monitoring metrics, Prometheus API-compatible, provides query interface via VMUI.
- VMAlert: Evaluates alert rules, pushes events to Alertmanager.
- VictoriaLogs: Centralized log collection and storage. All nodes run Vector by default, pushing system and database logs here.
- VictoriaTraces: Collects slow SQL, service traces, and other trace data.
- AlertManager: Aggregates alert events, dispatches notifications (email, Webhook, etc.).
- BlackboxExporter: Probes IP/VIP/URL reachability via ICMP/TCP/HTTP.
- DNSMASQ: Provides DNS resolution for internal domain names.
- Chronyd: NTP time sync service ensuring consistent time across all nodes.
- PostgreSQL: CMDB and default database.
- Ansible: Runs playbooks, orchestrates all infrastructure.
INFRA module is optional for PG HA. For example, Slim Install mode doesn’t install INFRA.
However, INFRA provides supporting services needed for prod-grade HA PG clusters, strongly recommended for full Pigsty DBaaS experience.
If you have existing infra (Nginx, local repo, monitoring, DNS, NTP), you can disable INFRA module and configure Pigsty to use existing infrastructure instead.
Nginx
Nginx = Pigsty web UI entry point—HTTP/HTTPS on ports 80/443 by default.
Web UIs with infrastructure components exposed via Nginx: Grafana, VictoriaMetrics (VMUI), AlertManager, and HAProxy traffic console. Local yum/apt repo static files also served via Nginx.
Nginx routes based on infra_portal configuration—domain-based proxy to upstream components. Customize for other or public domains:
infra_portal:  # domain names and upstream servers
  home         : { domain: i.pigsty }
  grafana      : { domain: g.pigsty ,endpoint: "${admin_ip}:3000" , websocket: true }
  prometheus   : { domain: p.pigsty ,endpoint: "${admin_ip}:8428" }   # VMUI
  alertmanager : { domain: a.pigsty ,endpoint: "${admin_ip}:9059" }
  blackbox     : { endpoint: "${admin_ip}:9115" }
  vmalert      : { endpoint: "${admin_ip}:8880" }
  #logs         : { domain: logs.pigsty ,endpoint: "${admin_ip}:9428" }
  #minio        : { domain: sss.pigsty ,endpoint: "${admin_ip}:9001" ,scheme: https ,websocket: true }
  #pgadmin      : { domain: adm.pigsty ,endpoint: "127.0.0.1:8885" }
  #pgweb        : { domain: cli.pigsty ,endpoint: "127.0.0.1:8886" }
  #bytebase     : { domain: ddl.pigsty ,endpoint: "127.0.0.1:8887" }
  #jupyter      : { domain: lab.pigsty ,endpoint: "127.0.0.1:8888"   ,websocket: true }
  #gitea        : { domain: git.pigsty ,endpoint: "127.0.0.1:8889" }
  #wiki         : { domain: wiki.pigsty ,endpoint: "127.0.0.1:9002" }
  #noco         : { domain: noco.pigsty ,endpoint: "127.0.0.1:9003" }
  #supa         : { domain: supa.pigsty ,endpoint: "10.2.82.163:8000" ,websocket: true }
  #odoo         : { domain: odoo.pigsty ,endpoint: "127.0.0.1:8069"   ,websocket: true }
  #mm           : { domain: mm.pigsty ,endpoint: "10.2.82.163:8065" ,websocket: true }
  web.io:
    domain: en.pigsty
    path: "/www/web.io"
    certbot: pigsty.doc
    enforce_https: true
    config: |
      # rewrite /zh/ to /
      location /zh/ {
                rewrite ^/zh/(.*)$ /$1 permanent;
      }
  web.cc:
    domain: pigsty.cc
    path: "/www/web.cc"
    domains: [ zh.pigsty.cc ]
    certbot: pigsty.doc
    config: |
      # rewrite /zh/ to /
      location /zh/ {
                rewrite ^/zh/(.*)$ /$1 permanent;
      }
  repo:
    domain: pro.pigsty
    path: "/www/repo"
    index: true
    certbot: pigsty.doc
Pigsty strongly recommends domain access over IP+port:
- Enables HTTPS encryption, consolidates to Nginx, audits all requests, integrates auth.
- Some components only listen on 127.0.0.1—only accessible via Nginx proxy.
- Domains easier to remember, extra flexibility.
If no internet domain or local DNS resolution, add local static records in /etc/hosts (MacOS/Linux) or C:\Windows\System32\drivers\etc\hosts (Windows).
Nginx config: Configuration: INFRA - NGINX.
Local Software Repository
Pigsty creates local repo during install on INFRA nodes to accelerate subsequent software installation.
Repo served by Nginx, default location /www/pigsty, accessible via http://i.pigsty/pigsty.
Pigsty’s offline package = entire built repo directory (yum/apt) compressed. When building local repo, if /www/pigsty exists with /www/pigsty/repo_complete marker, considers repo already built—skips upstream downloads, eliminating internet dependency.
Repo definition file: /www/pigsty.repo, accessible via http://${admin_ip}/pigsty.repo.
curl -L http://i.pigsty/pigsty.repo -o /etc/yum.repos.d/pigsty.repo
Or use file local repo without Nginx:
[pigsty-local]
name=Pigsty local $releasever - $basearch
baseurl=file:///www/pigsty/
enabled=1
gpgcheck=0
Local repo config: Configuration: INFRA - REPO.
Victoria Observability Suite
Pigsty v4.0 uses VictoriaMetrics family—unified monitoring, logging, tracing:
- VictoriaMetrics: Default port
8428, accessible viahttp://p.pigstyorhttps://i.pigsty/vmetrics/, Prometheus API-compatible. - VMAlert: Evaluates alert rules in
/infra/rules/*.yml, port8880, sends events to Alertmanager. - VictoriaLogs: Default port
9428, supports log search viahttps://i.pigsty/vlogs/. All nodes run Vector by default, pushing structured system logs, PG logs here. - VictoriaTraces: Port
10428for slow SQL / Trace collection. Grafana accesses as Jaeger datasource. - AlertManager: Port
9059, accessible viahttp://a.pigstyorhttps://i.pigsty/alertmgr/for managing alert notifications. Configure SMTP, Webhook, etc. to push messages. - Blackbox Exporter: Default port
9115for Ping/TCP/HTTP probing, accessible viahttps://i.pigsty/blackbox/.
More: Configuration: INFRA - VICTORIA and Configuration: INFRA - PROMETHEUS.
Grafana
Grafana = Pigsty web UI core, default port 3000, accessible via IP:3000 or domain http://g.pigsty.
Pigsty includes preconfigured datasources for VictoriaMetrics / Logs / Traces (vmetrics-*, vlogs-*, vtraces-*), plus numerous dashboards with URL navigation for quick problem location.
Grafana = low-code visualization platform. Pigsty installs plugins (ECharts, victoriametrics-datasource) by default for building monitoring dashboards/inspection reports.
Grafana config: Configuration: INFRA - GRAFANA.
Ansible
Pigsty installs Ansible on meta node by default. Ansible = popular ops tool with declarative config style and idempotent playbook design—reduces system maintenance complexity.
DNSMASQ
DNSMASQ provides DNS resolution for internal Pigsty domain names. Other modules’ domain names register with DNSMASQ service on INFRA nodes.
DNS records: default location /etc/hosts.d/ on all INFRA nodes.
DNSMASQ config: Configuration: INFRA - DNS.
Chronyd
NTP service syncs time across all nodes in environment (optional).
NTP config: Configuration: NODE - NTP.
| Component | Port | Default Domain | Description |
|---|---|---|---|
| Nginx | 80/443 | i.pigsty | Web portal, local repo, unified entry |
| Grafana | 3000 | g.pigsty | Visualization platform, monitoring dashboards |
| VictoriaMetrics | 8428 | p.pigsty | TSDB, VMUI, Prometheus-compatible |
| VictoriaLogs | 9428 | - | Centralized log DB, Vector pushes logs |
| VictoriaTraces | 10428 | - | Tracing / slow SQL, Jaeger interface |
| VMAlert | 8880 | - | Alert rule evaluator |
| AlertManager | 9059 | a.pigsty | Alert aggregation, notifications |
| BlackboxExporter | 9115 | - | ICMP/TCP/HTTP probes |
| DNSMASQ | 53 | - | DNS server |
| Chronyd | 123 | - | NTP time server |
Feedback
Was this page helpful?
Thanks for the feedback! Please let us know how we can improve.
Sorry to hear that. Please let us know how we can improve.