This is the multi-page printable view of this section. Click here to print.

Return to the regular view of this page.

Monitoring

Overview of Pigsty’s monitoring system architecture and how to monitor existing PostgreSQL instances

This document introduces Pigsty’s monitoring system architecture, including metrics, logs, and target management. It also covers how to monitor existing PG clusters and remote RDS services.


Monitoring Overview

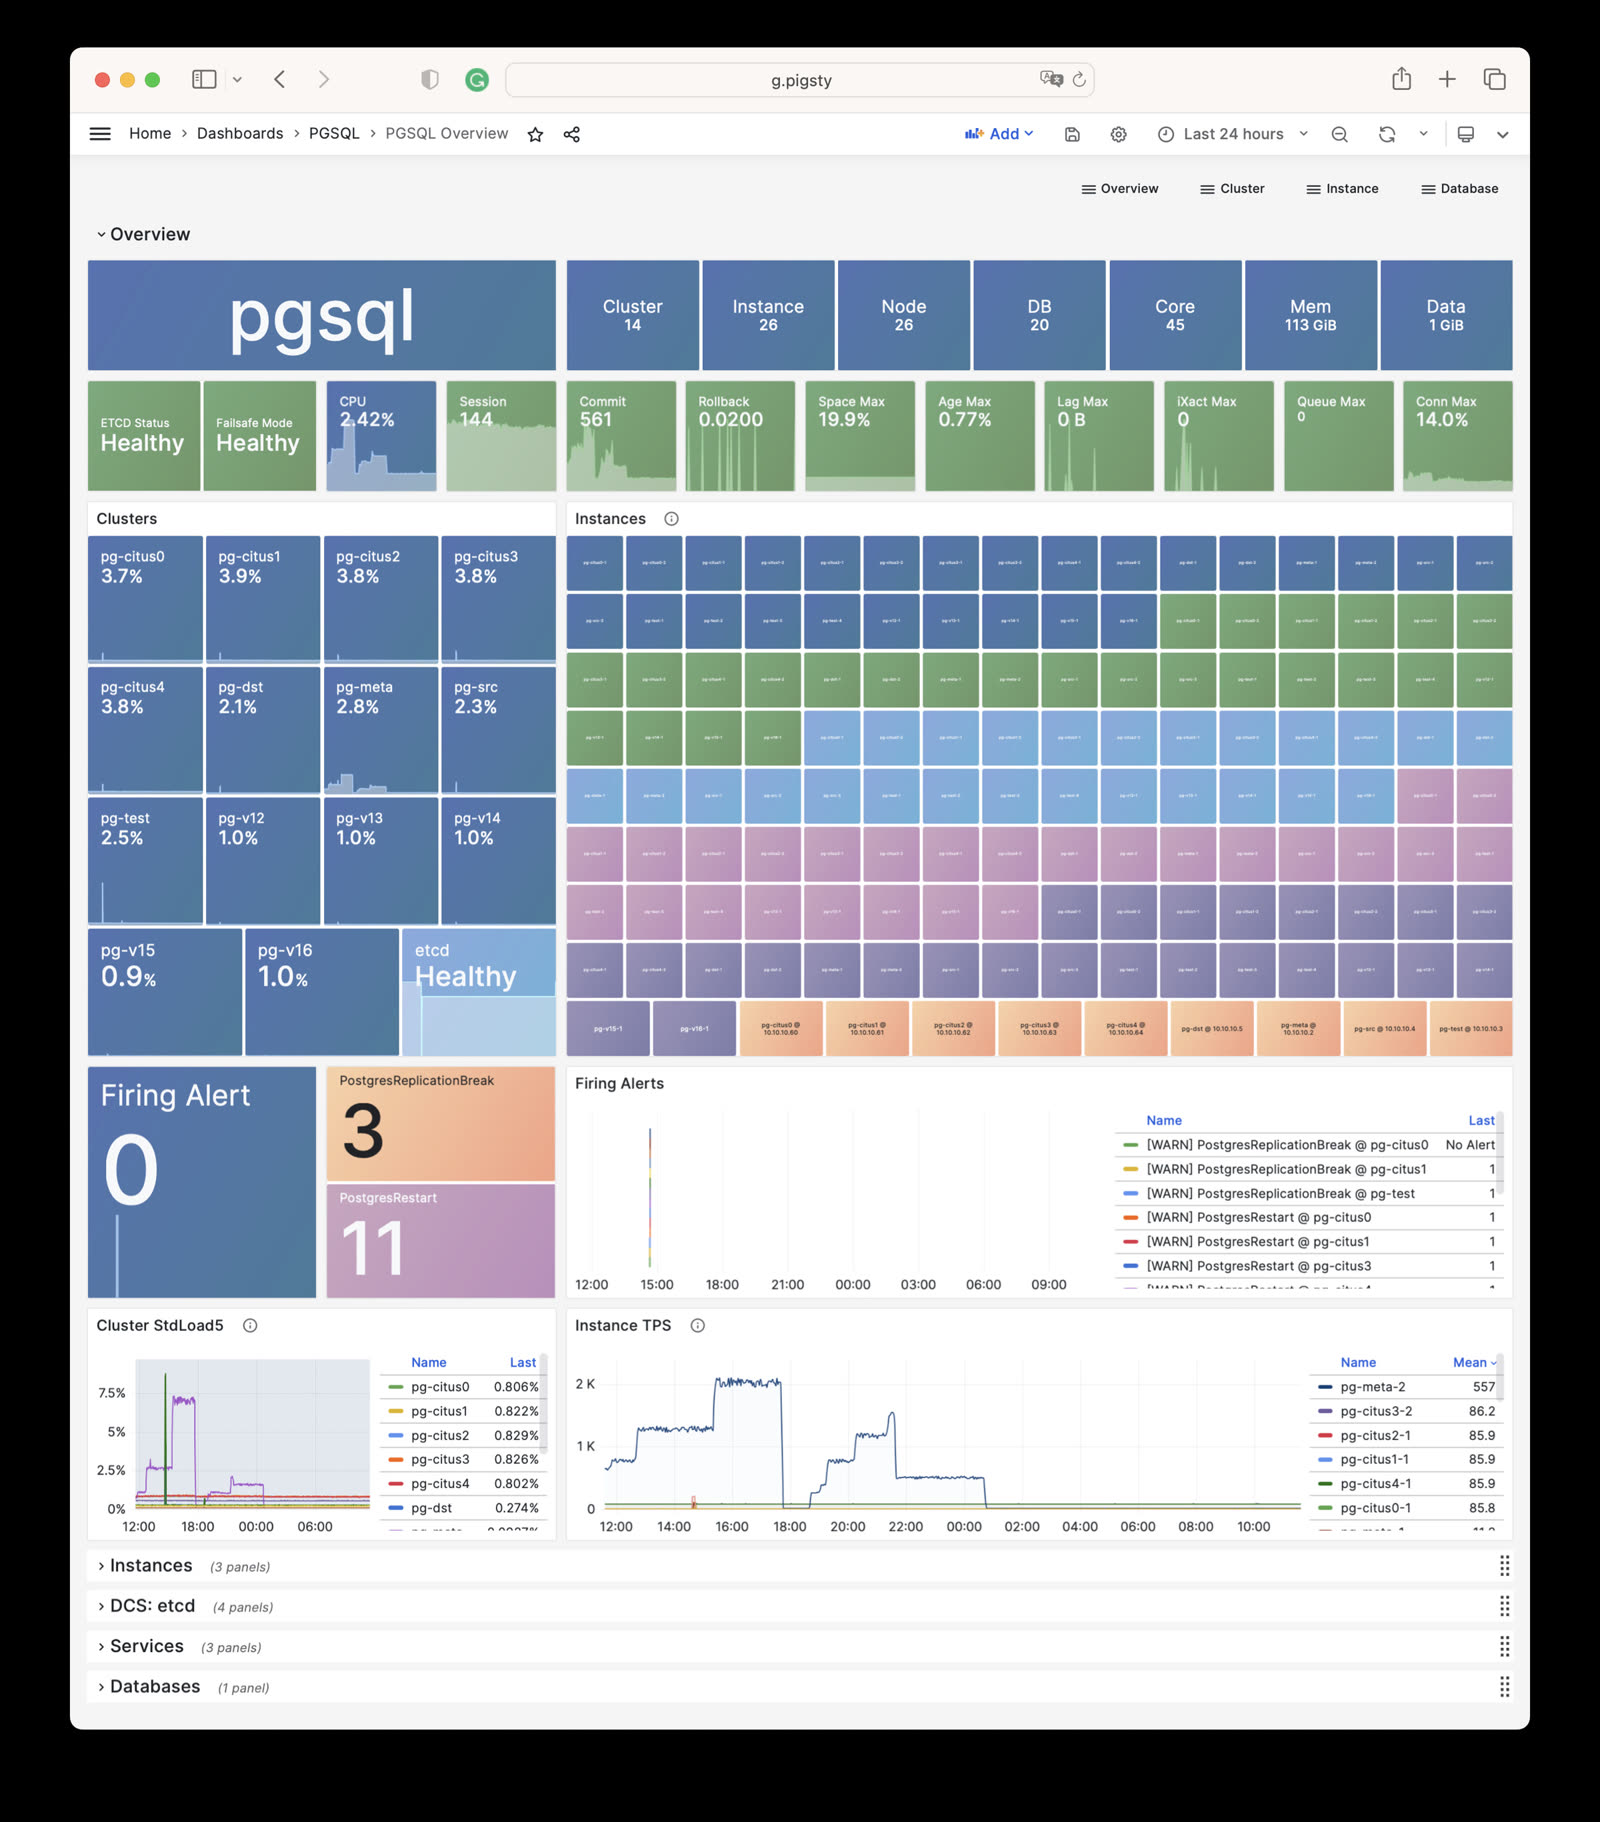
Pigsty uses a modern observability stack for PostgreSQL monitoring:

  • Grafana for metrics visualization and PostgreSQL datasource
  • VictoriaMetrics for collecting metrics from PostgreSQL / Pgbouncer / Patroni / HAProxy / Node
  • VictoriaLogs for logging PostgreSQL / Pgbouncer / Patroni / pgBackRest and host component logs
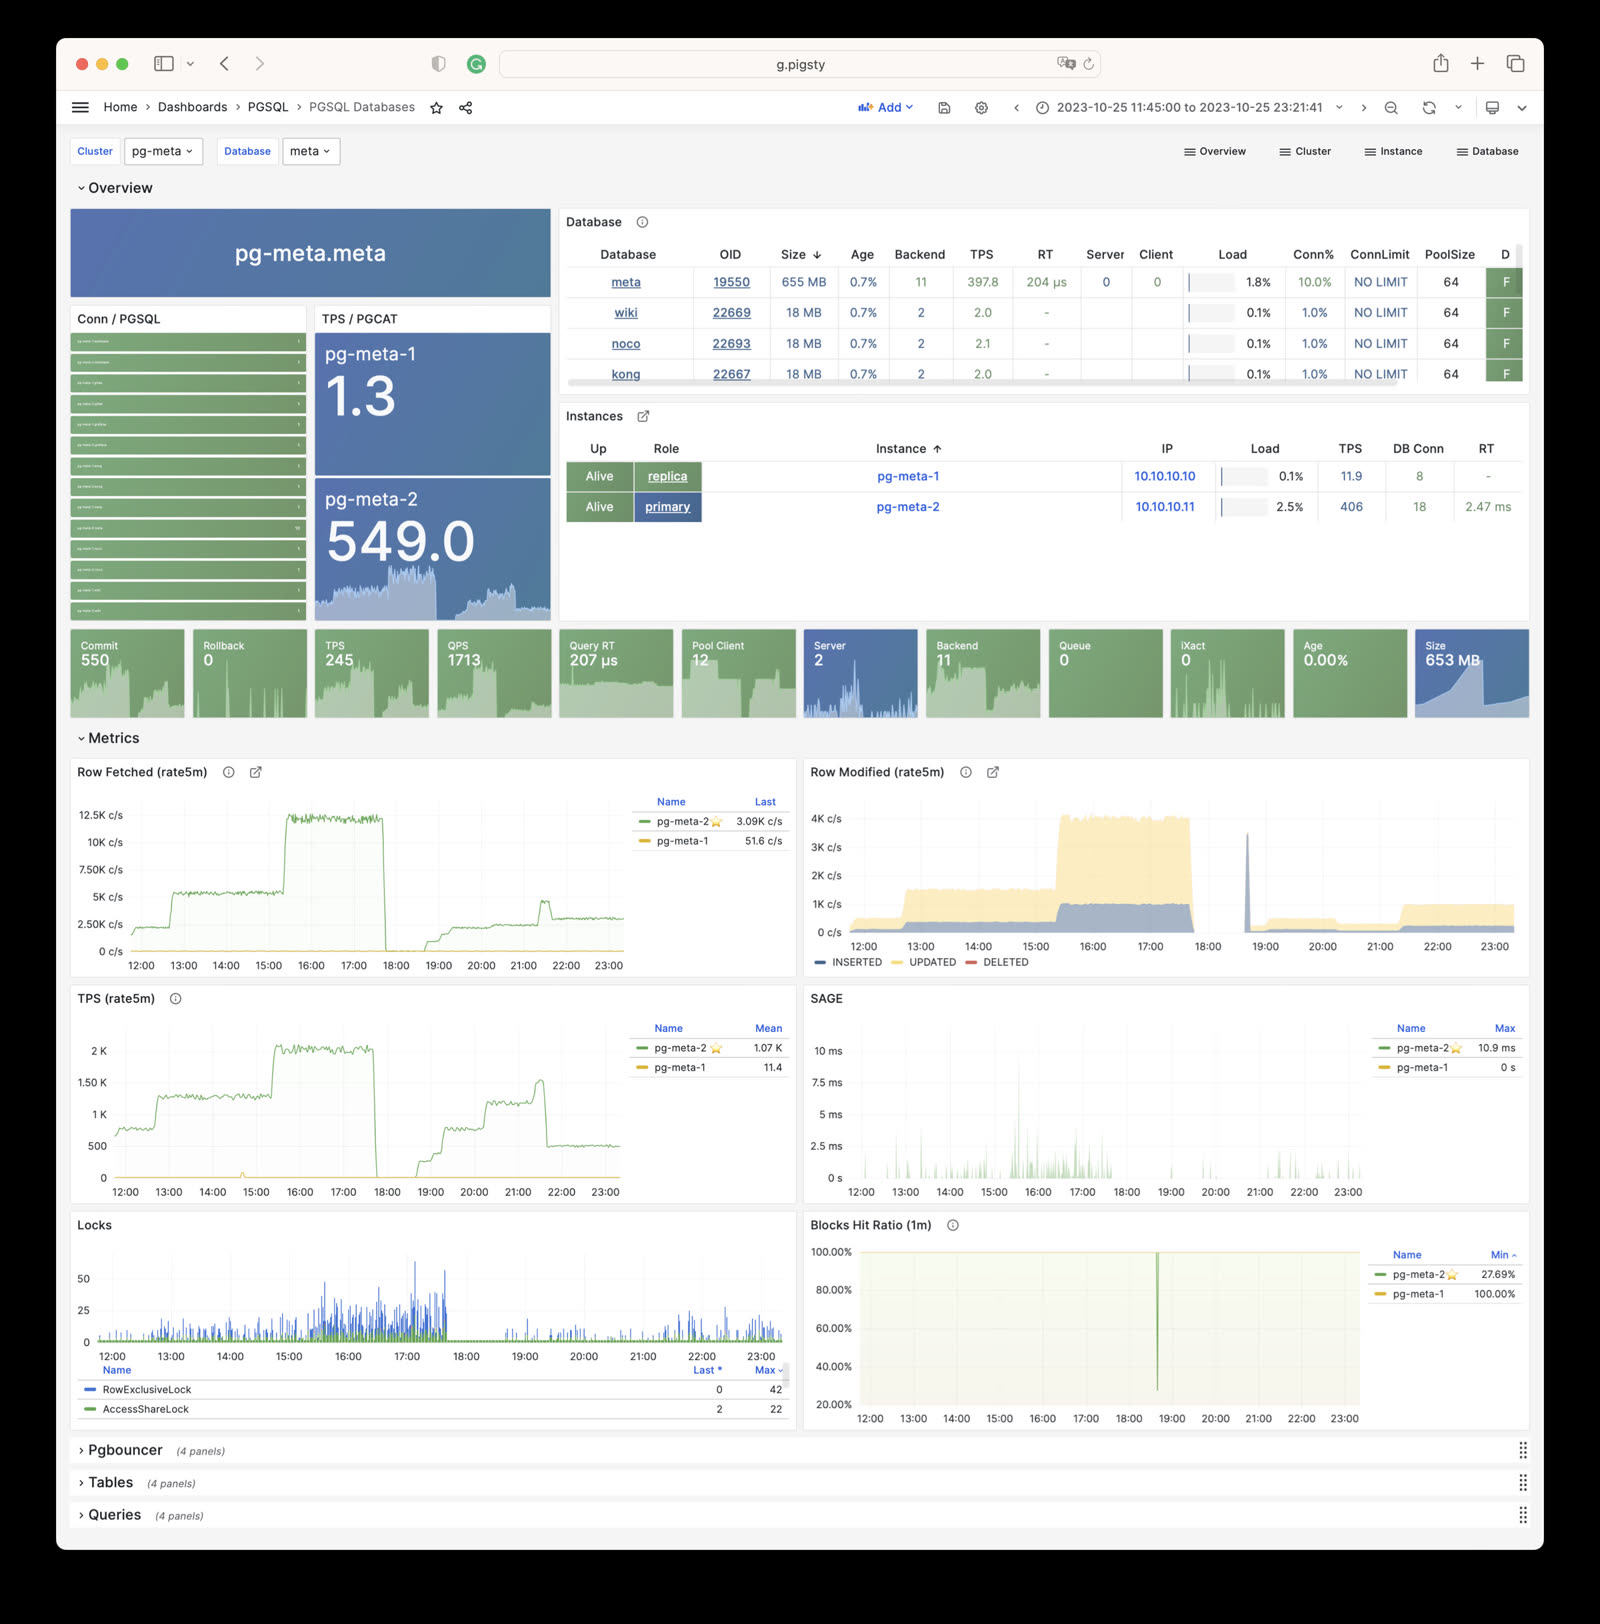
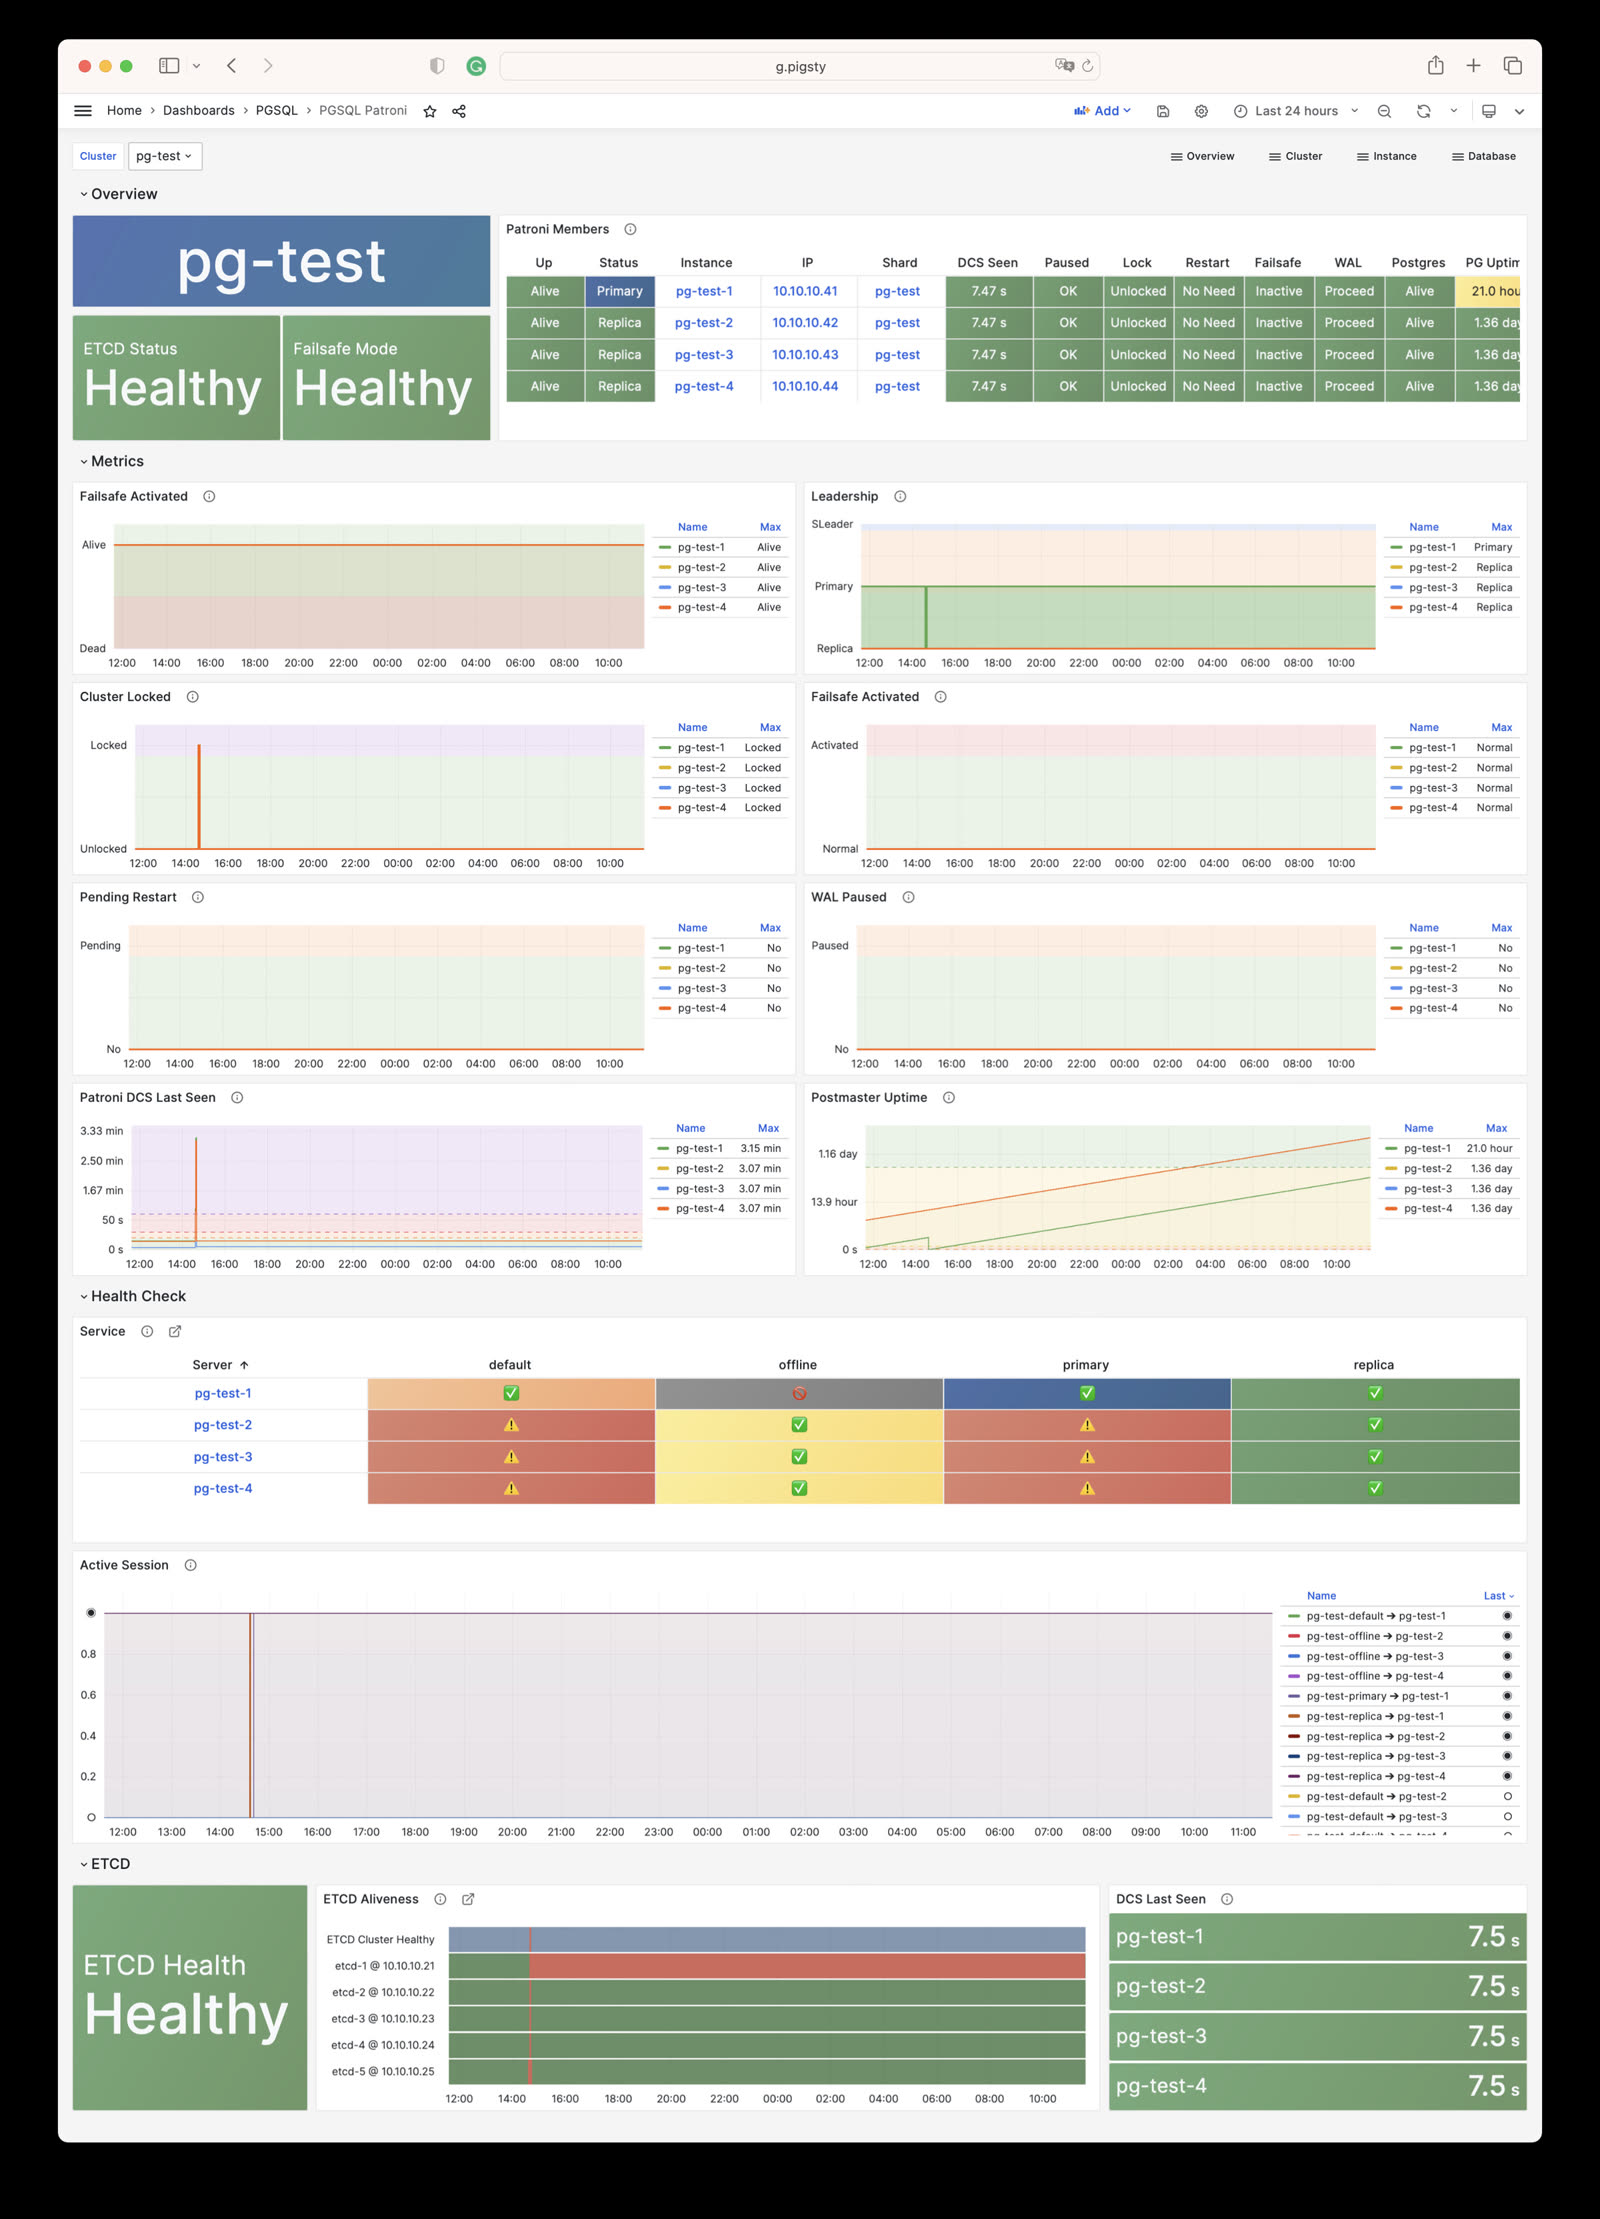
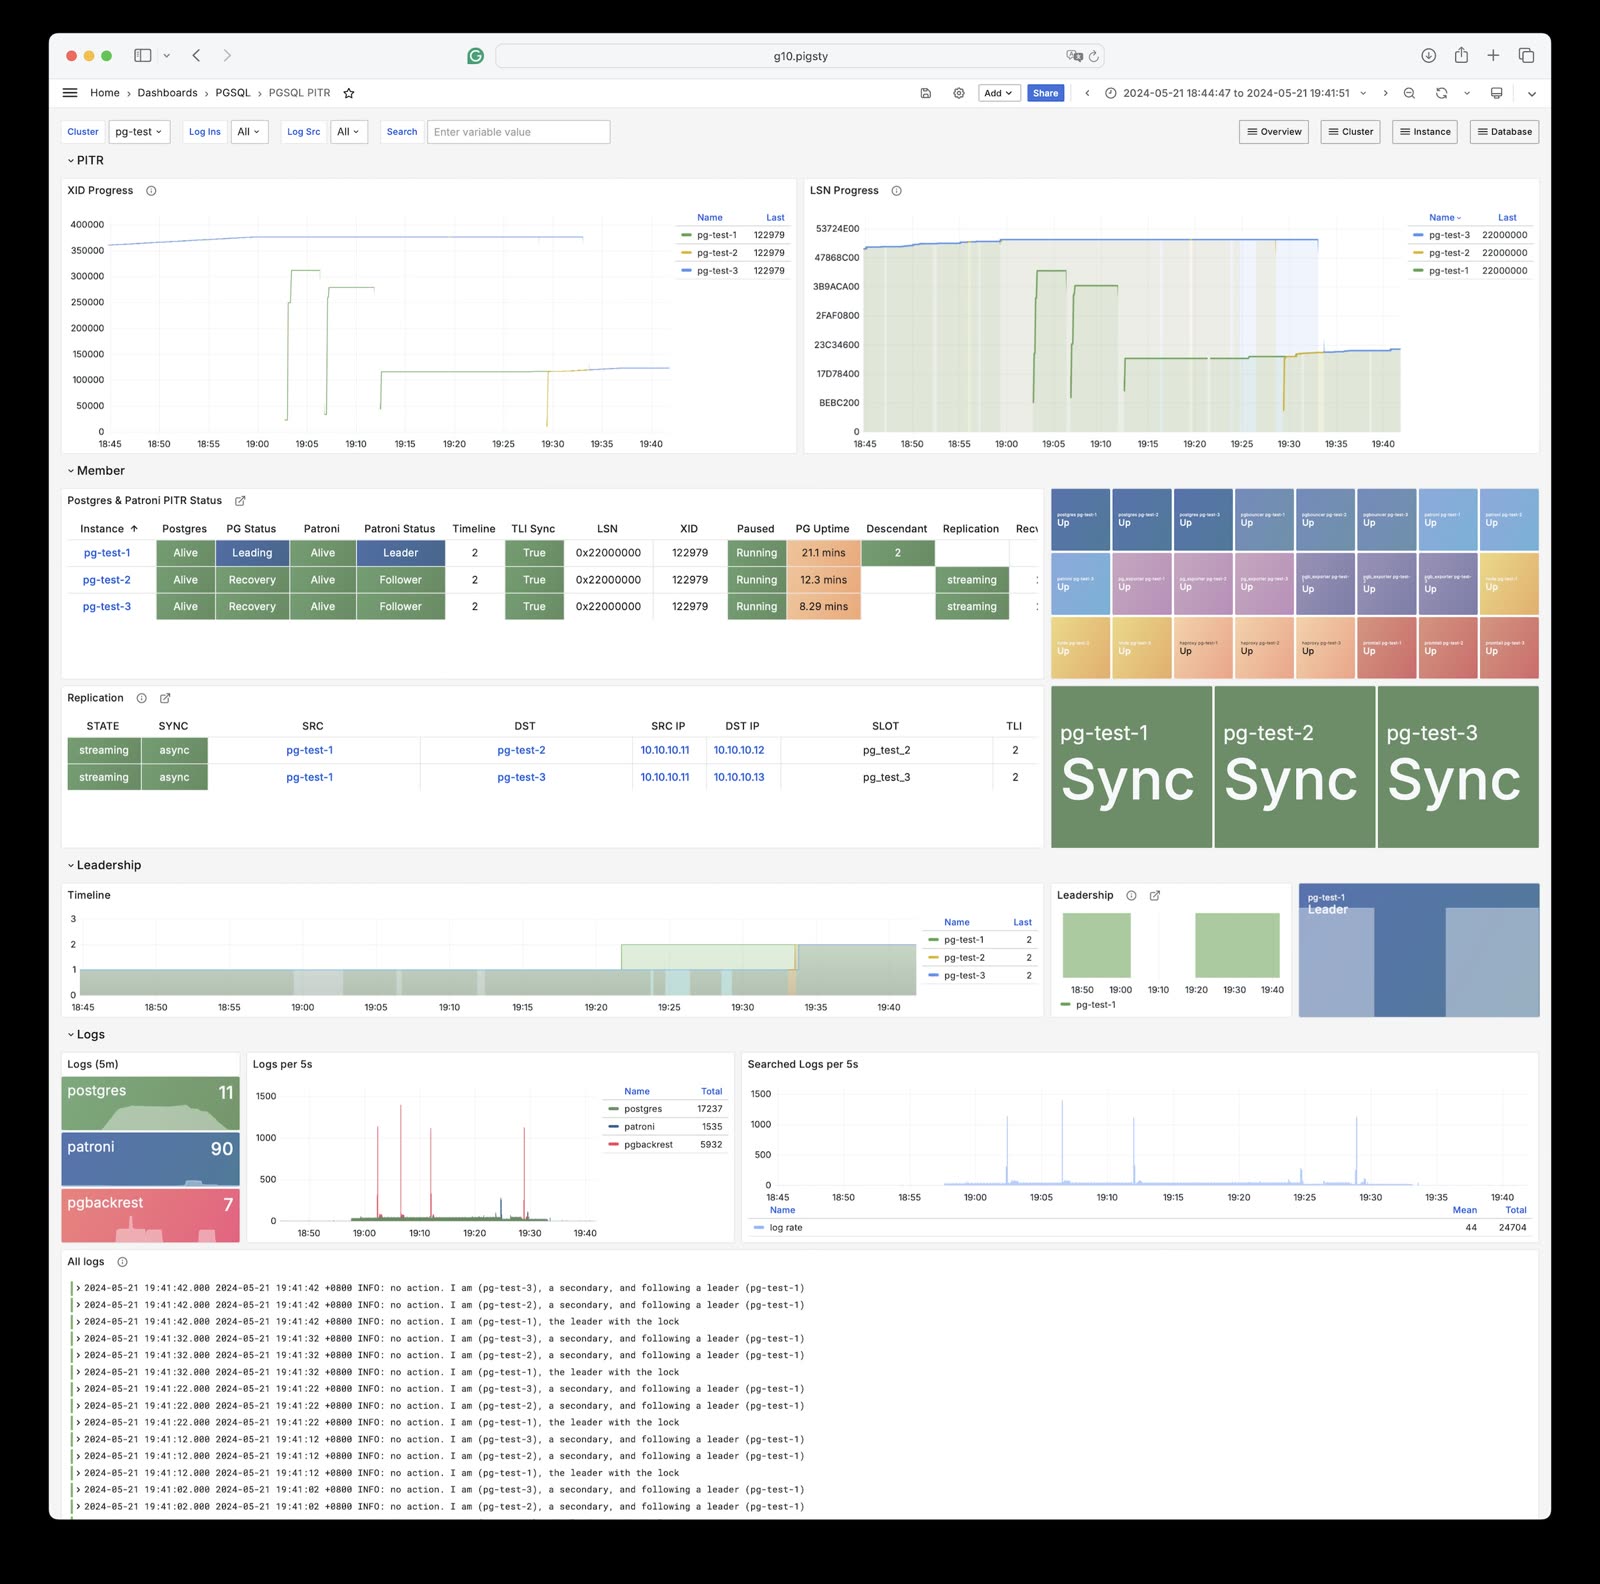
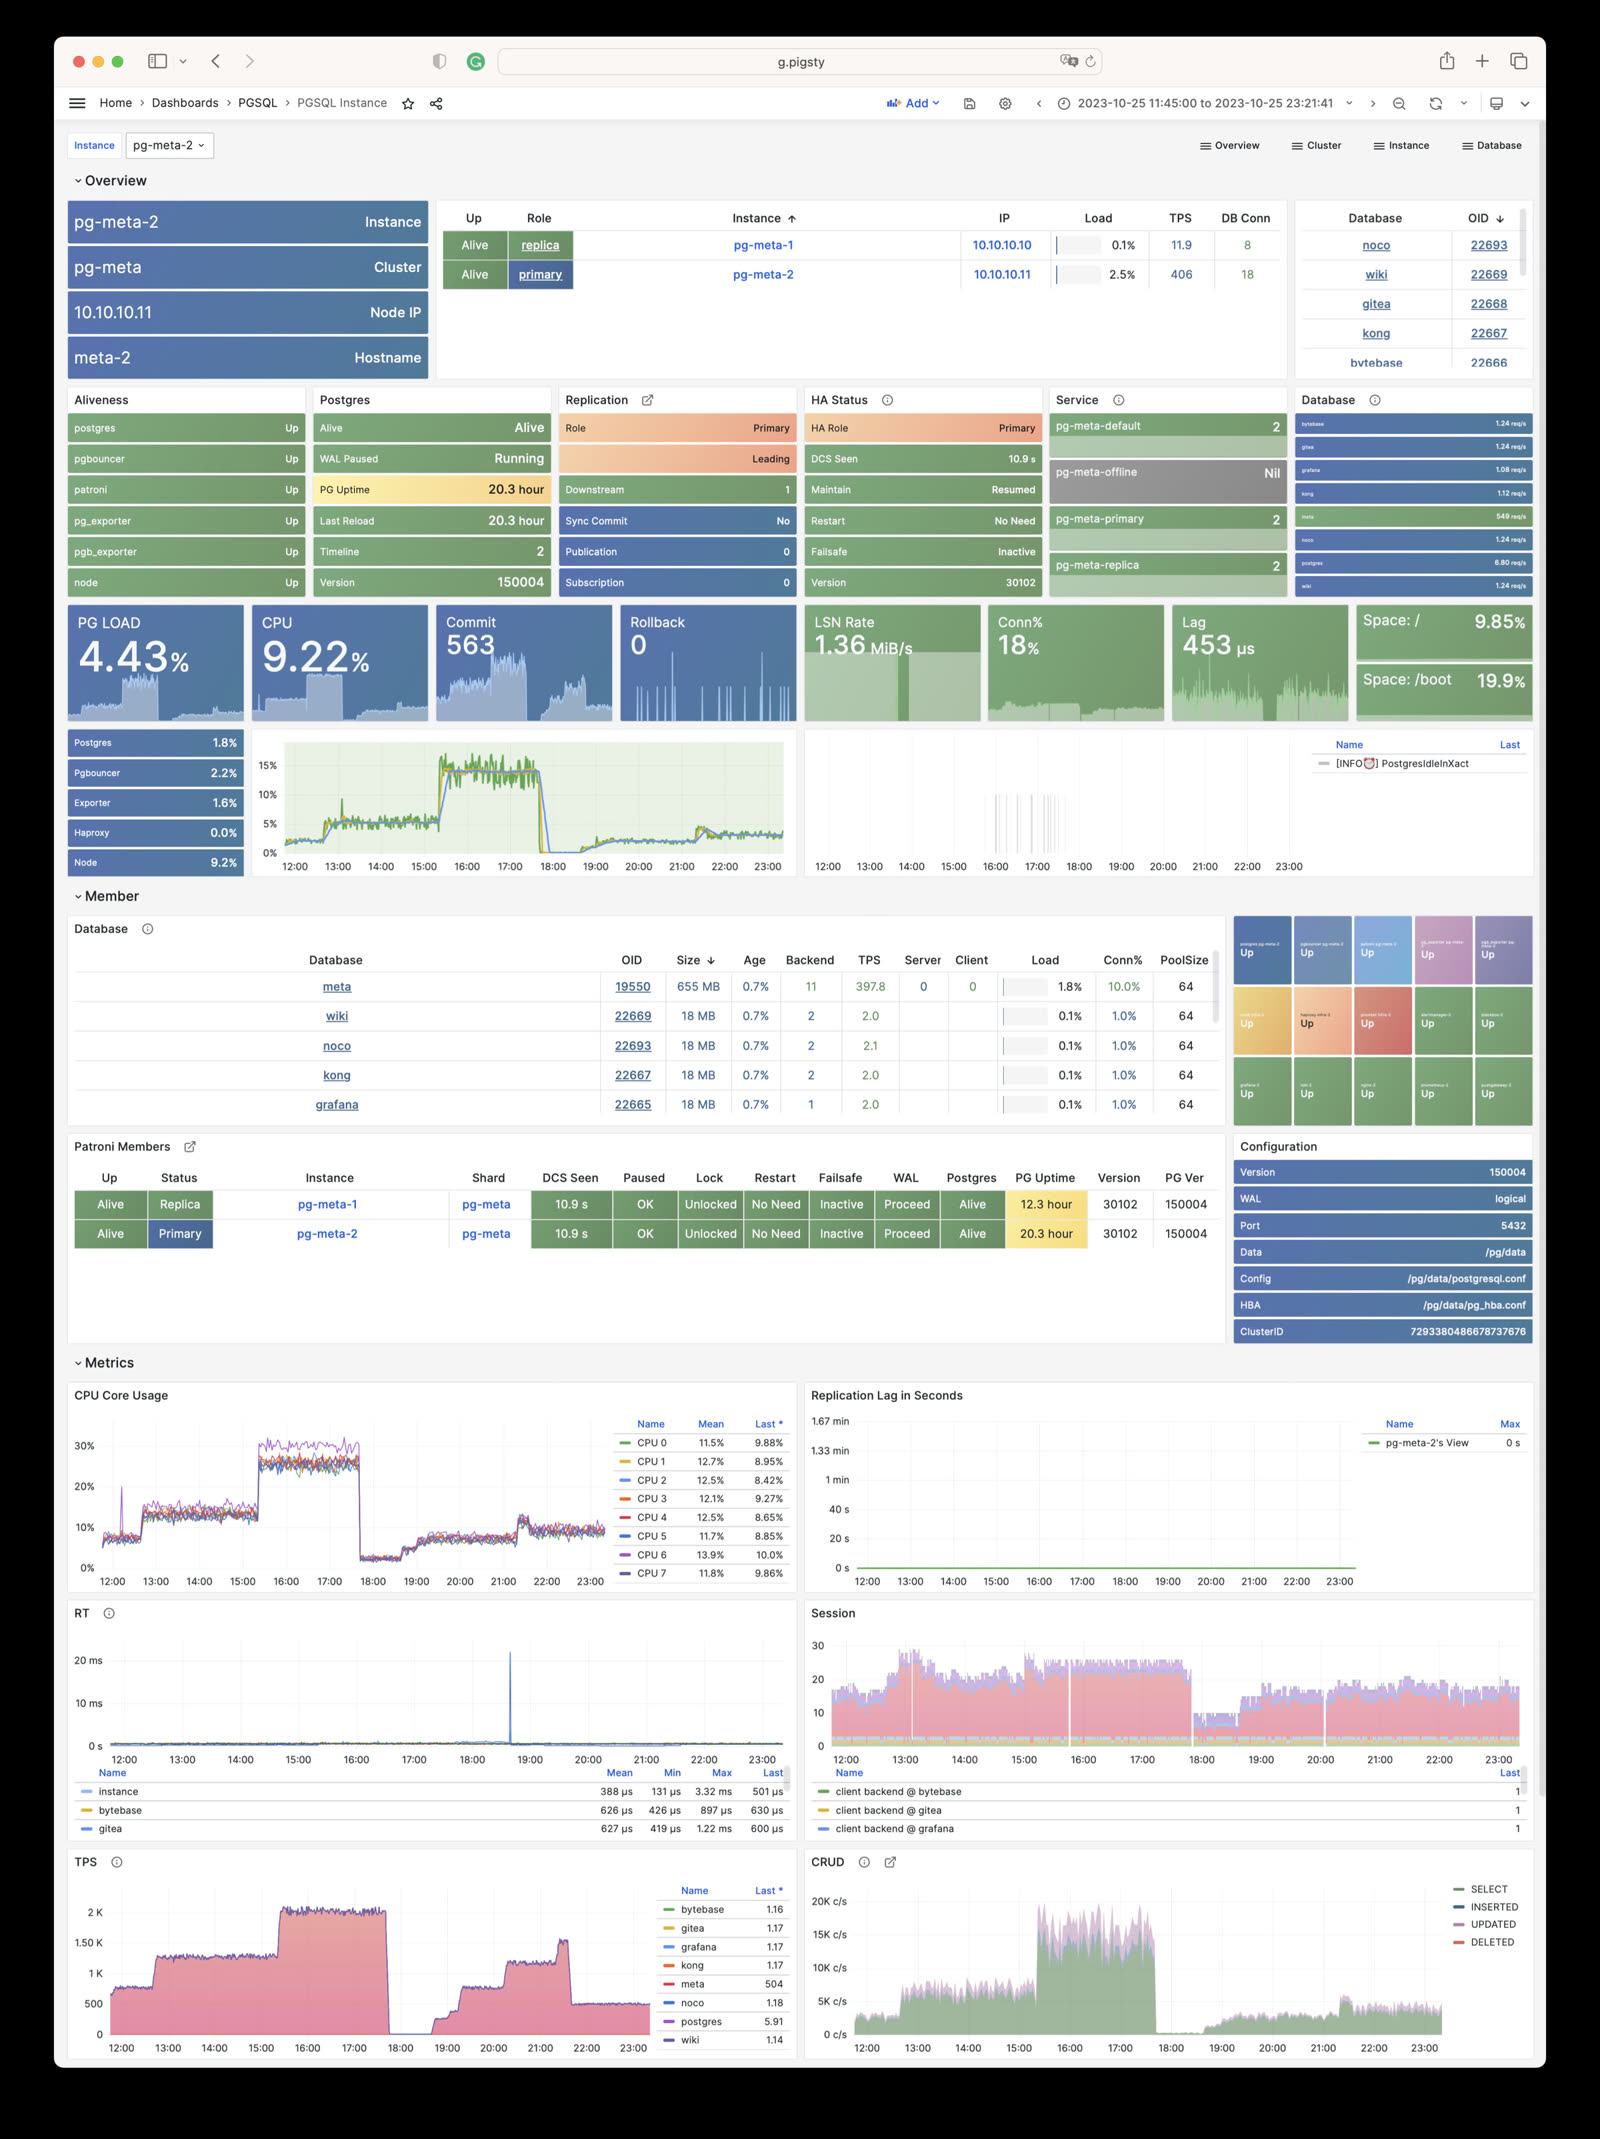
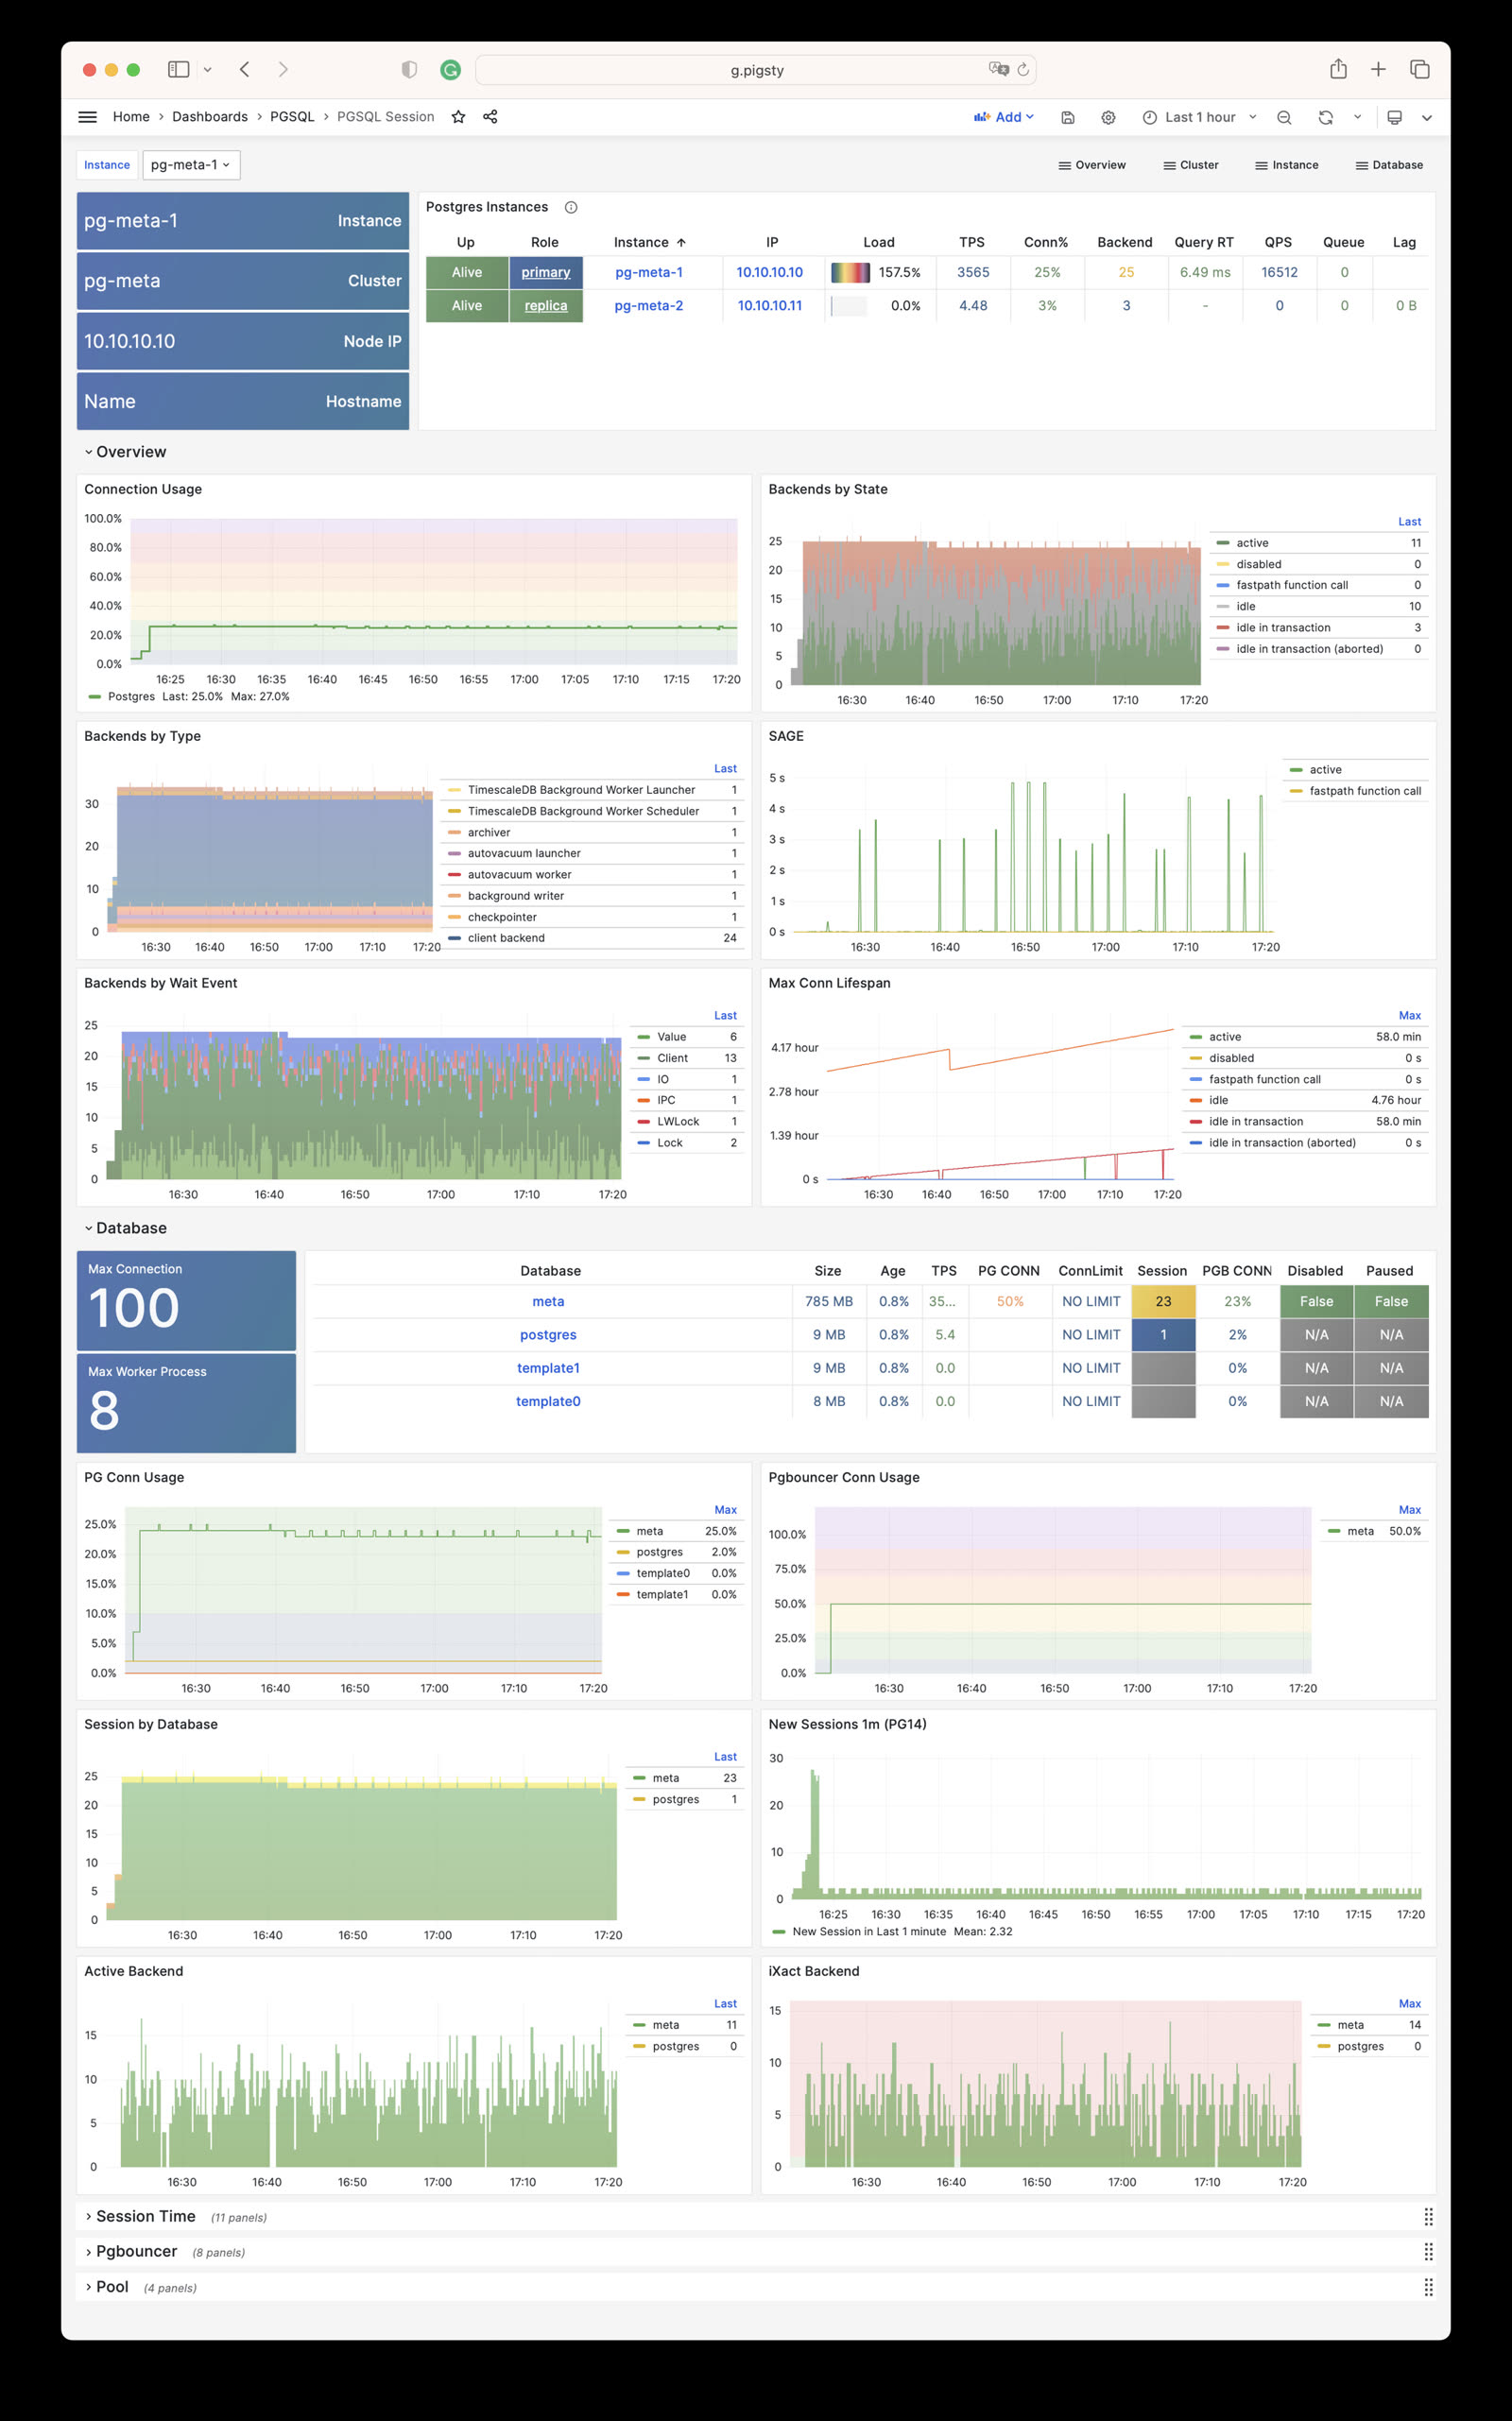
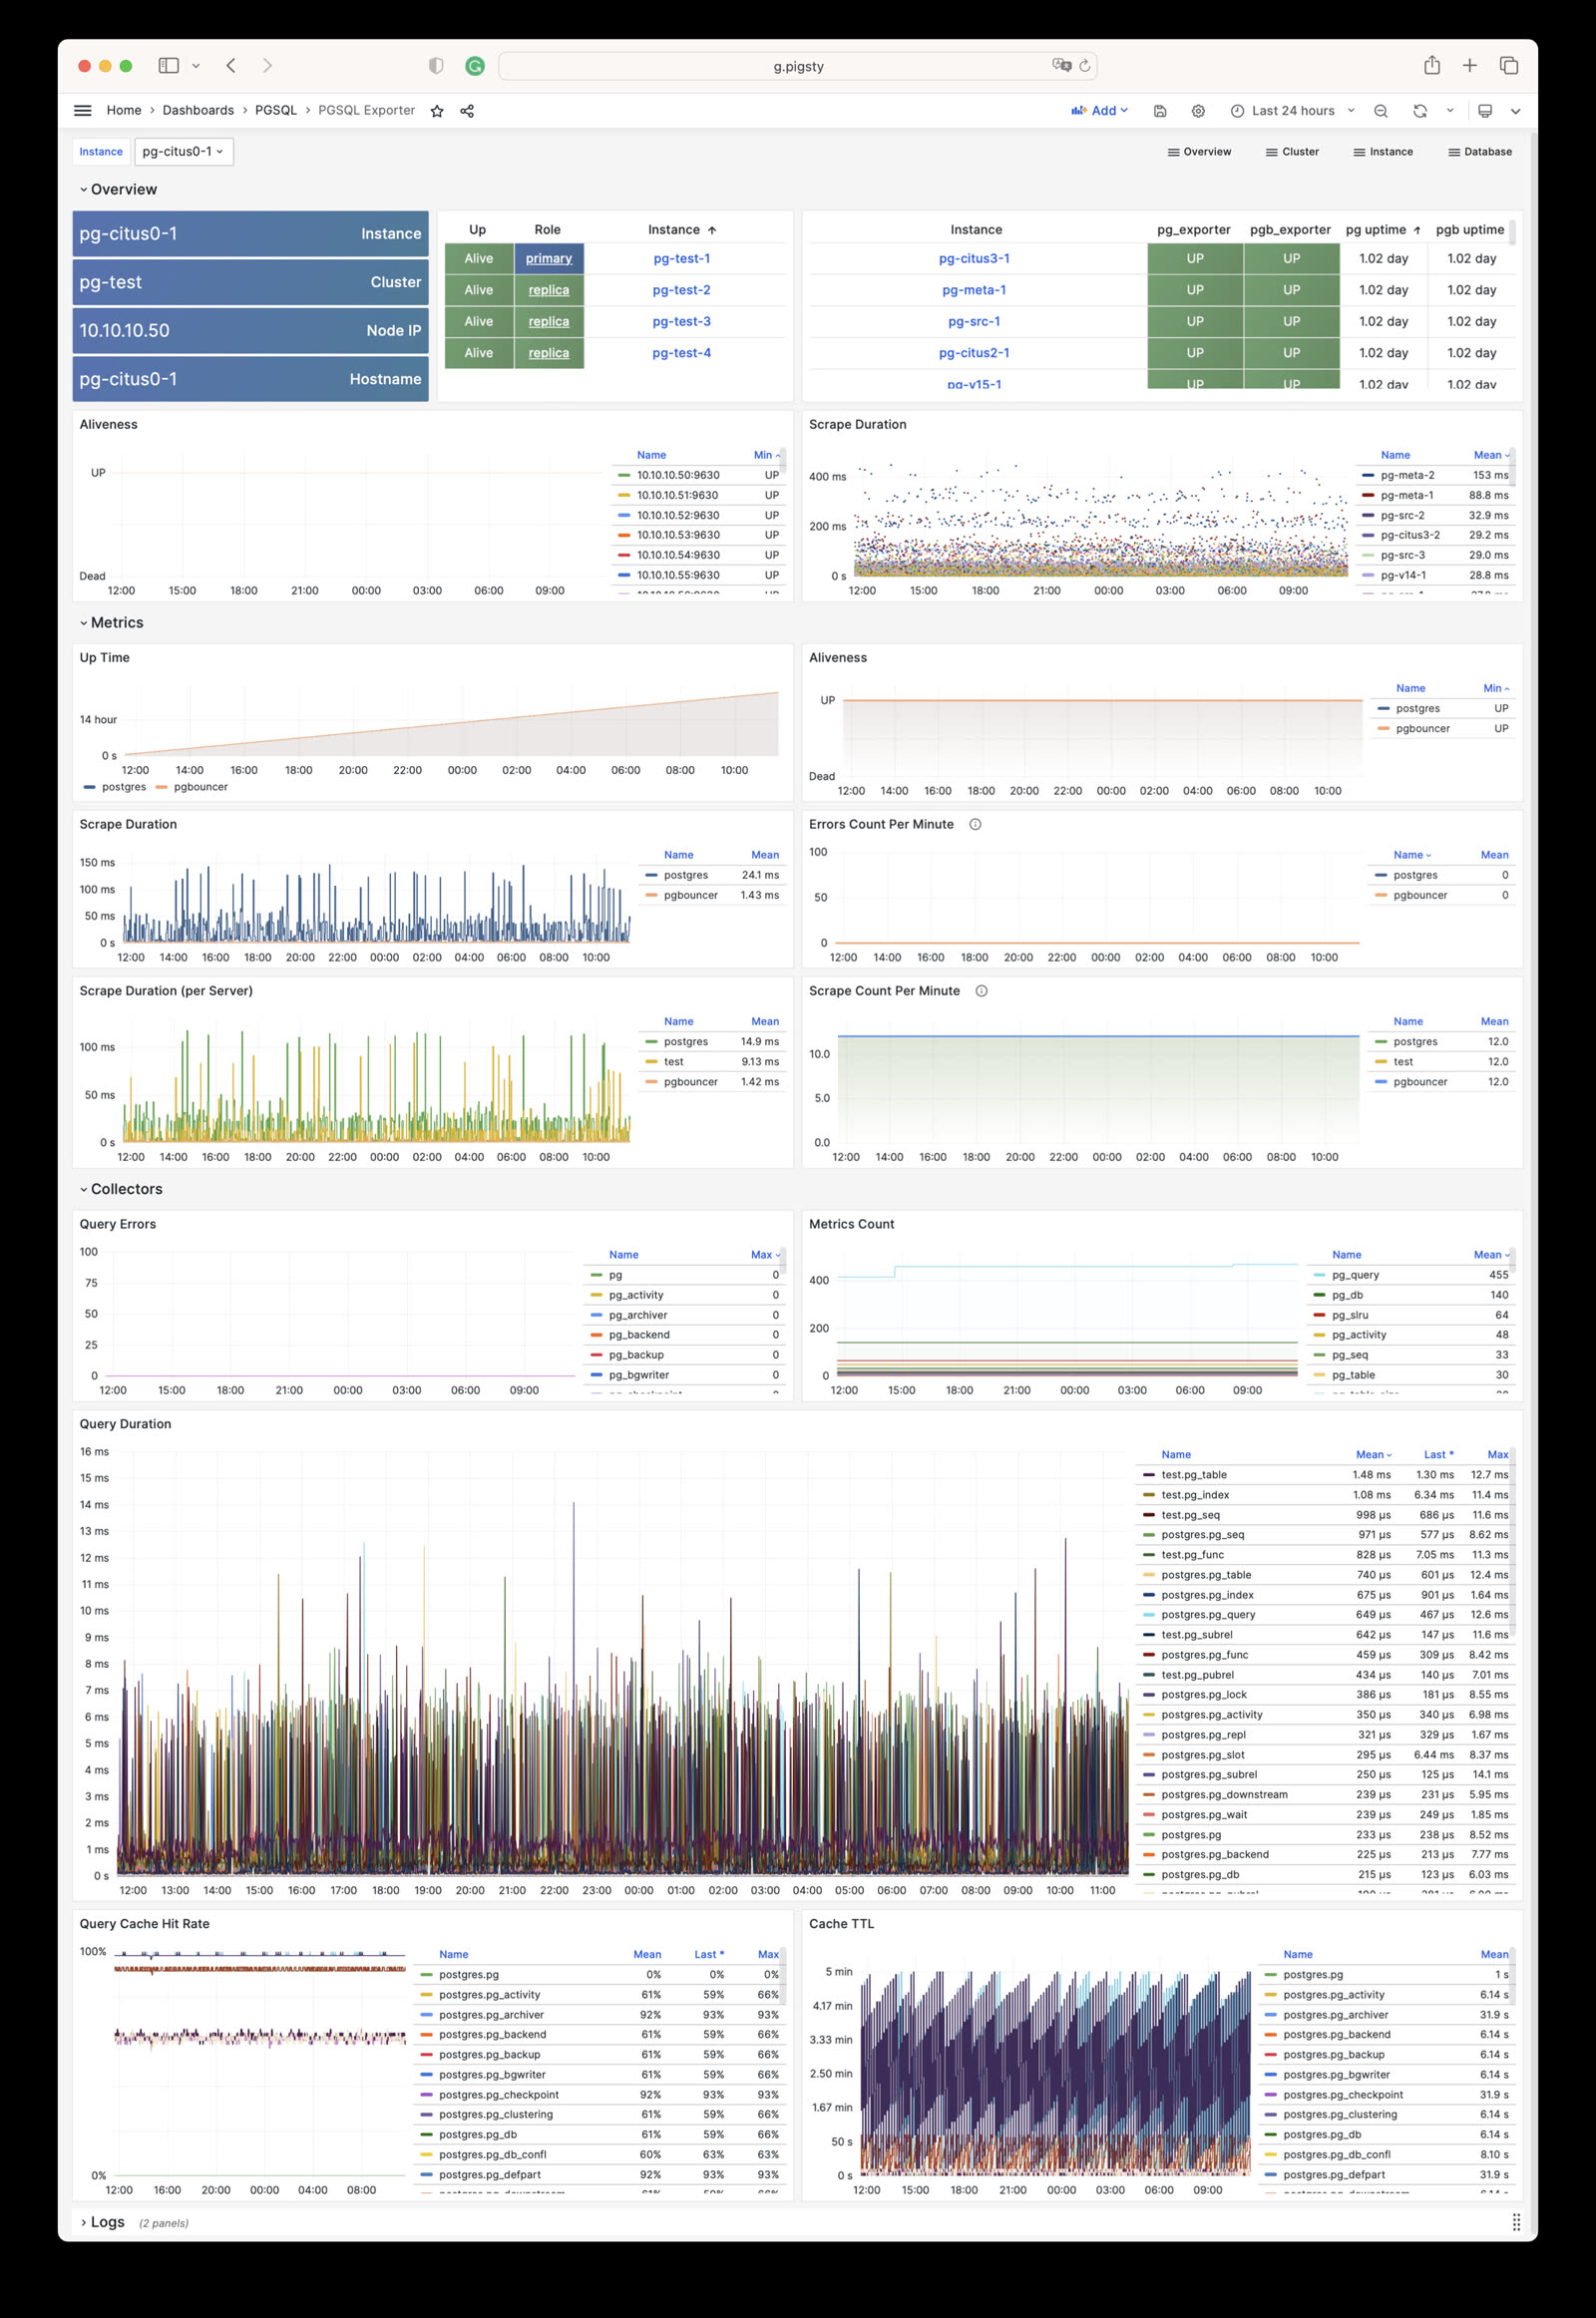
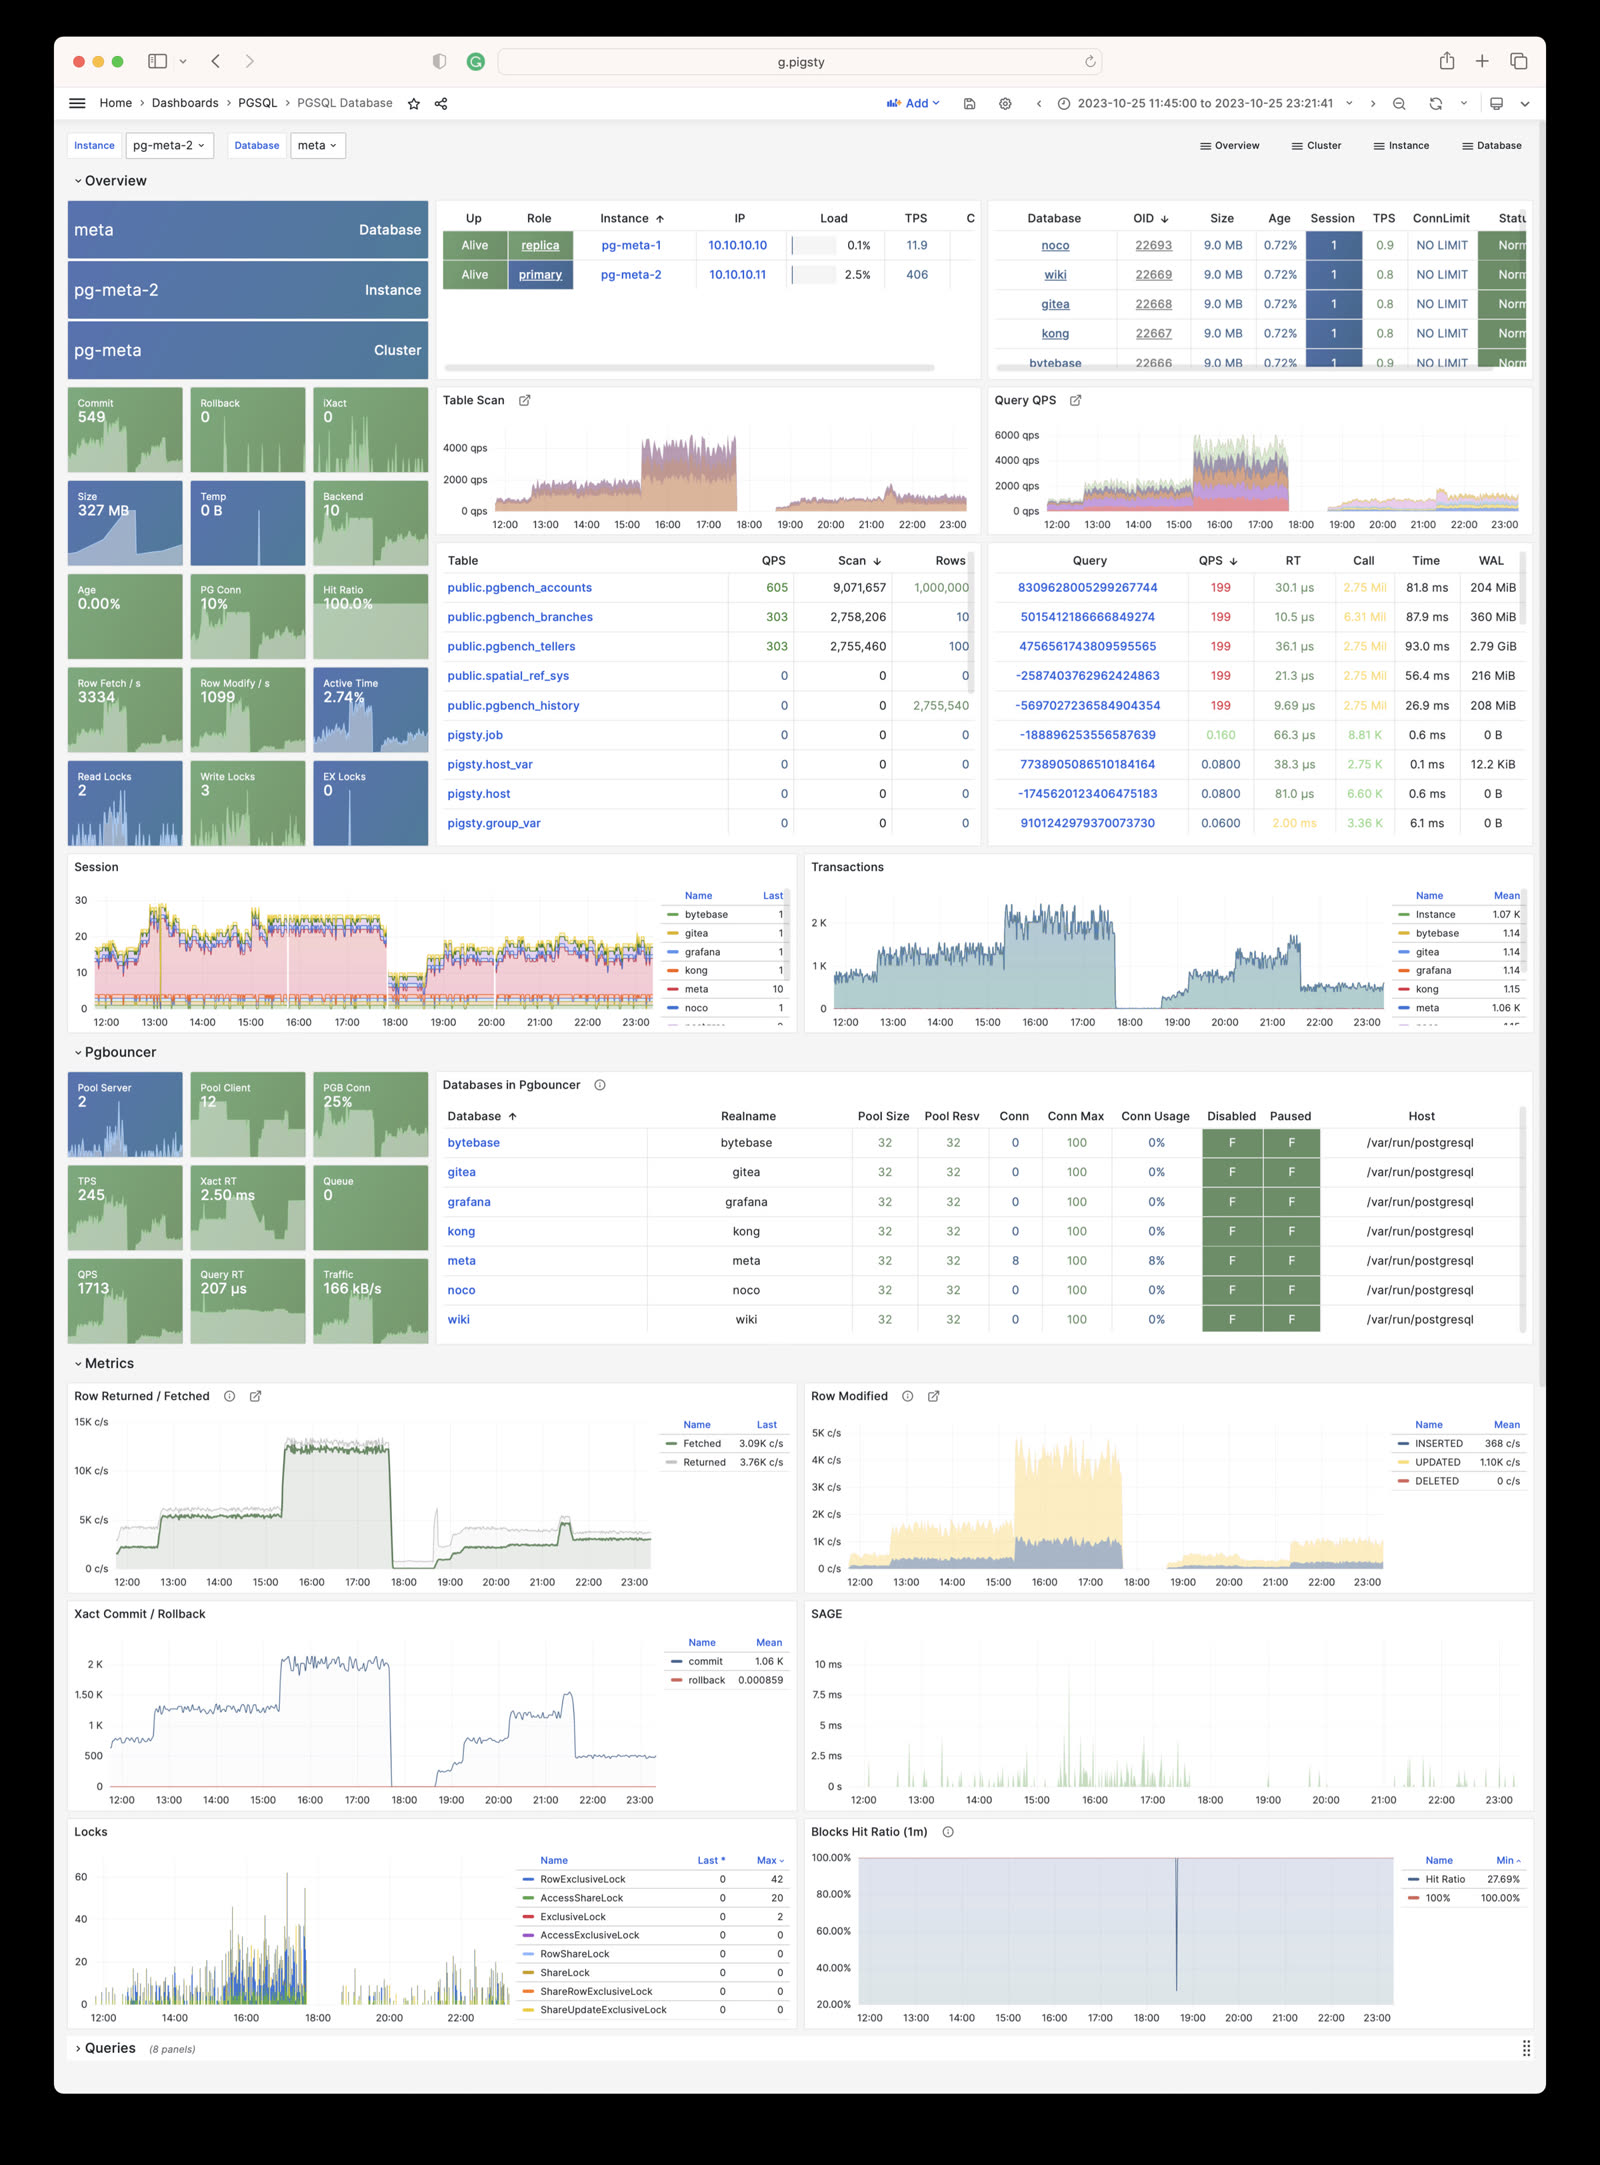
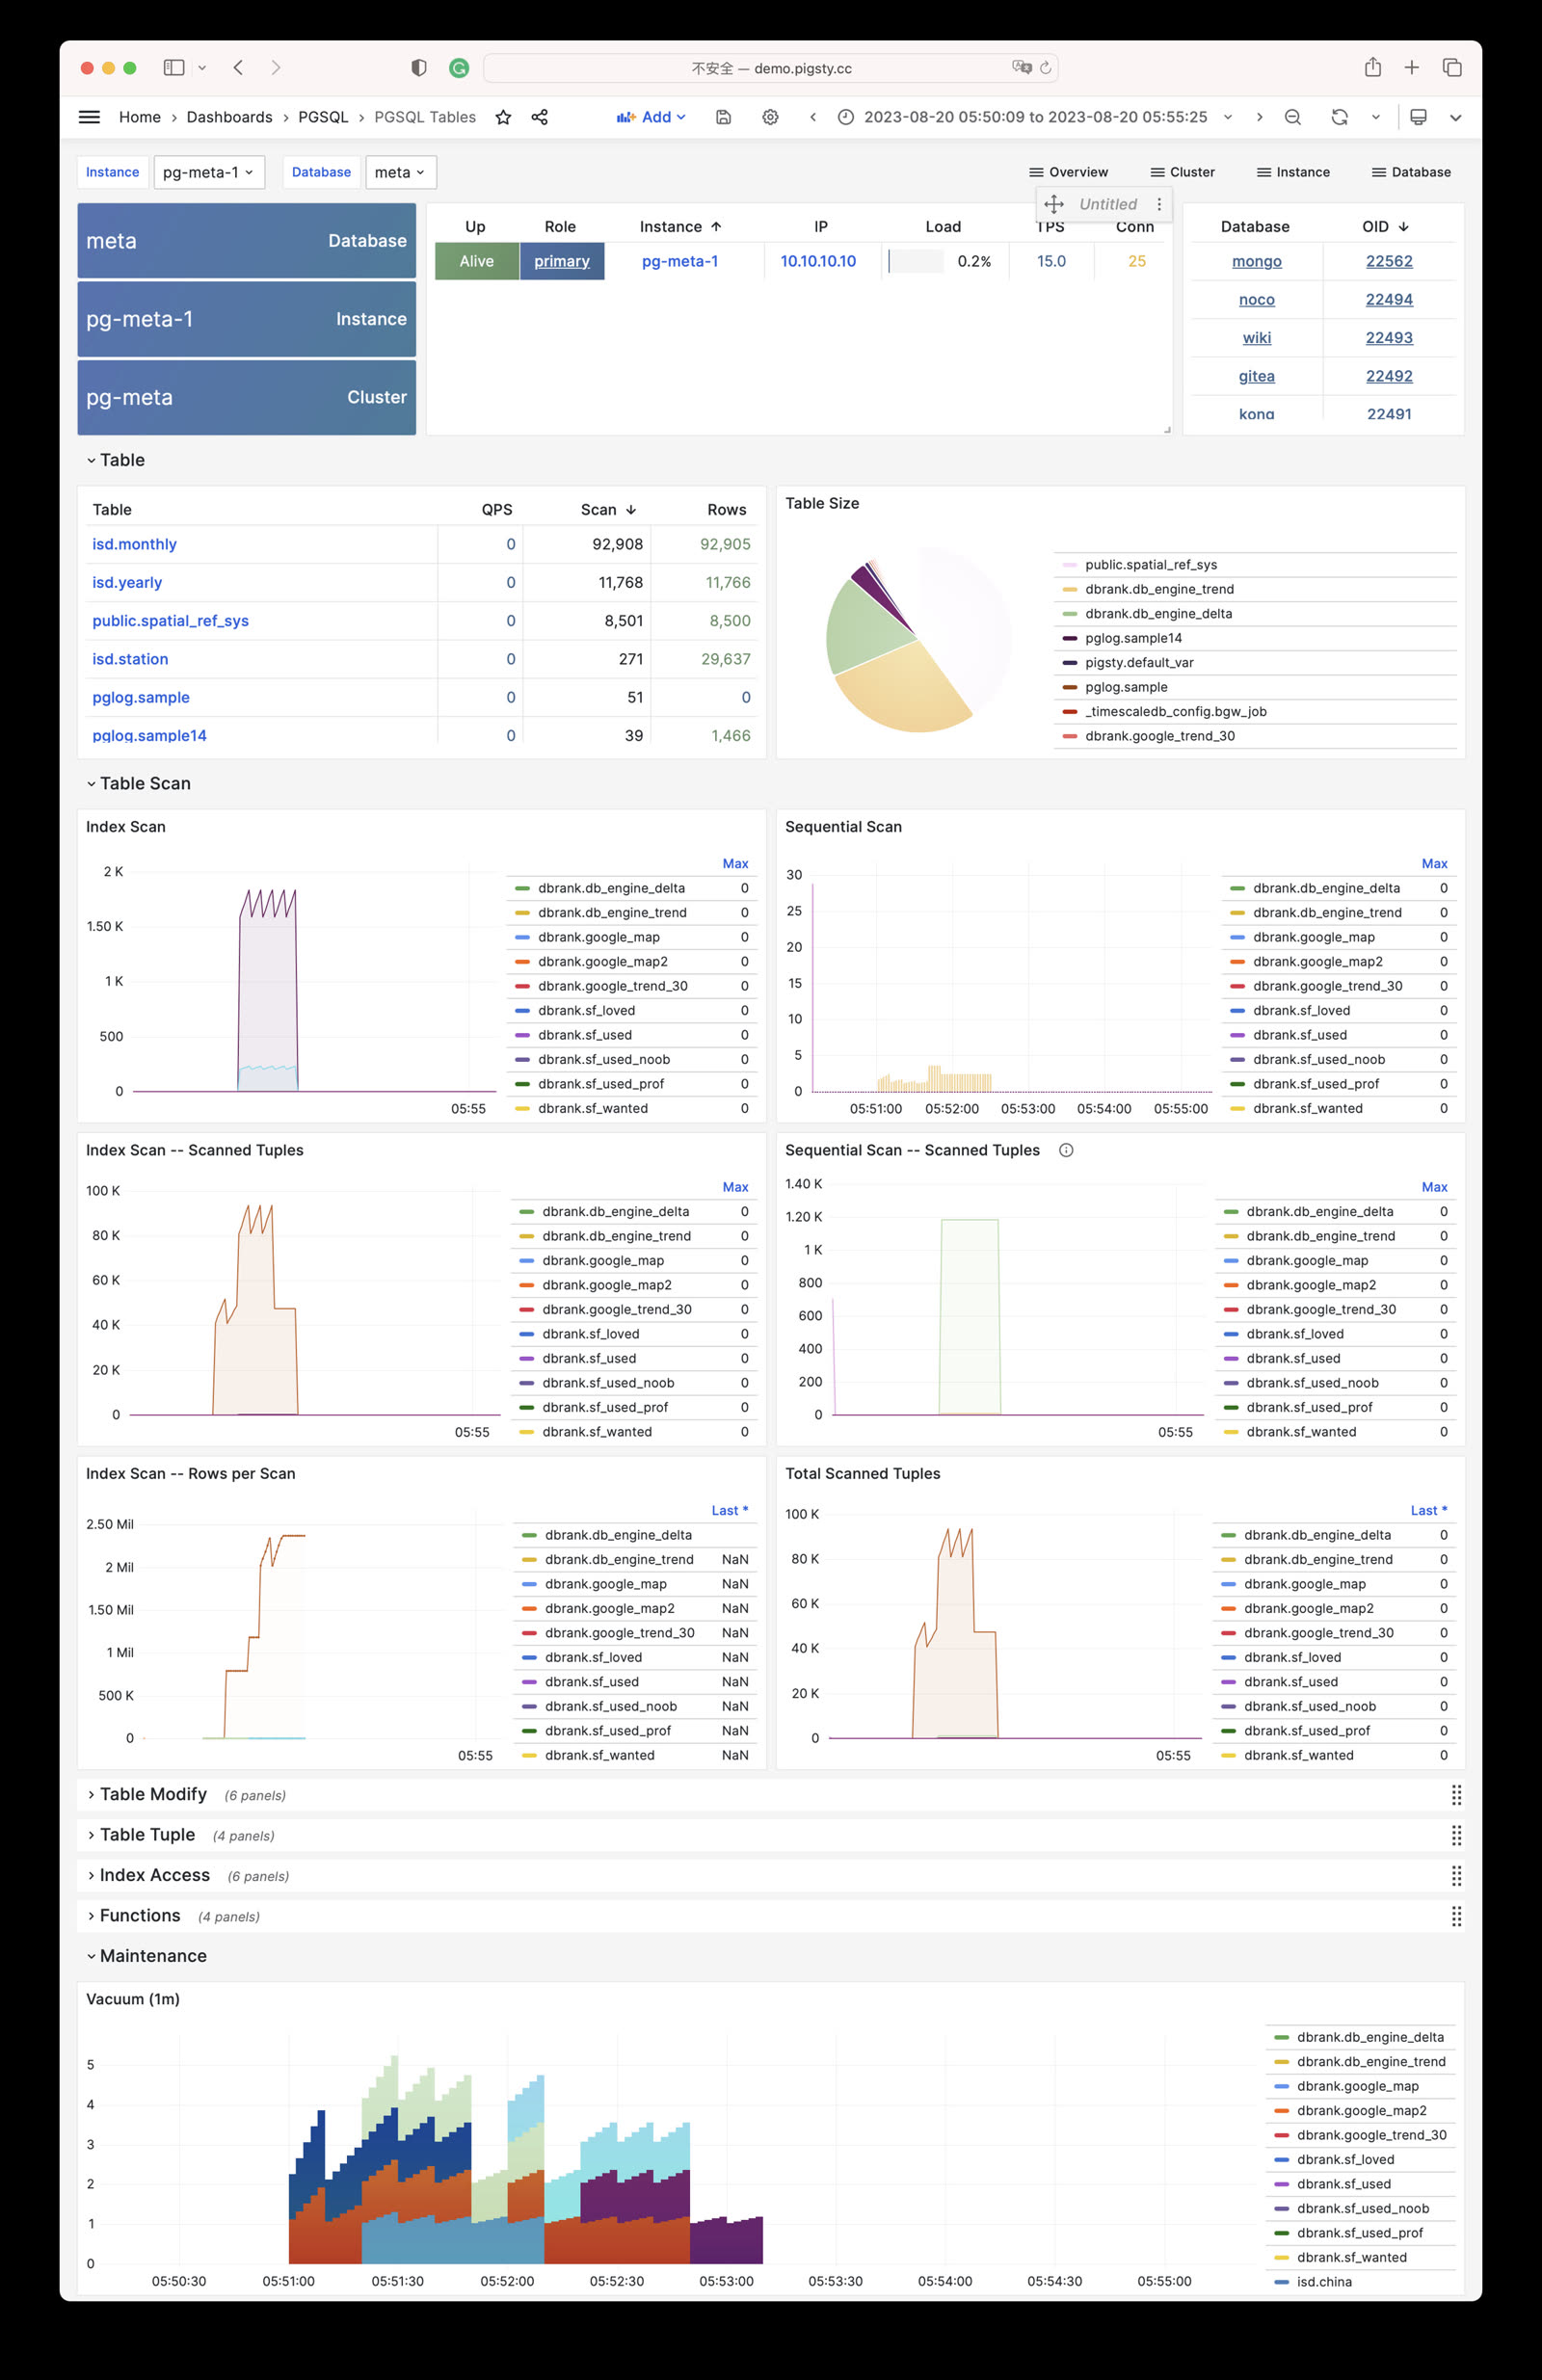
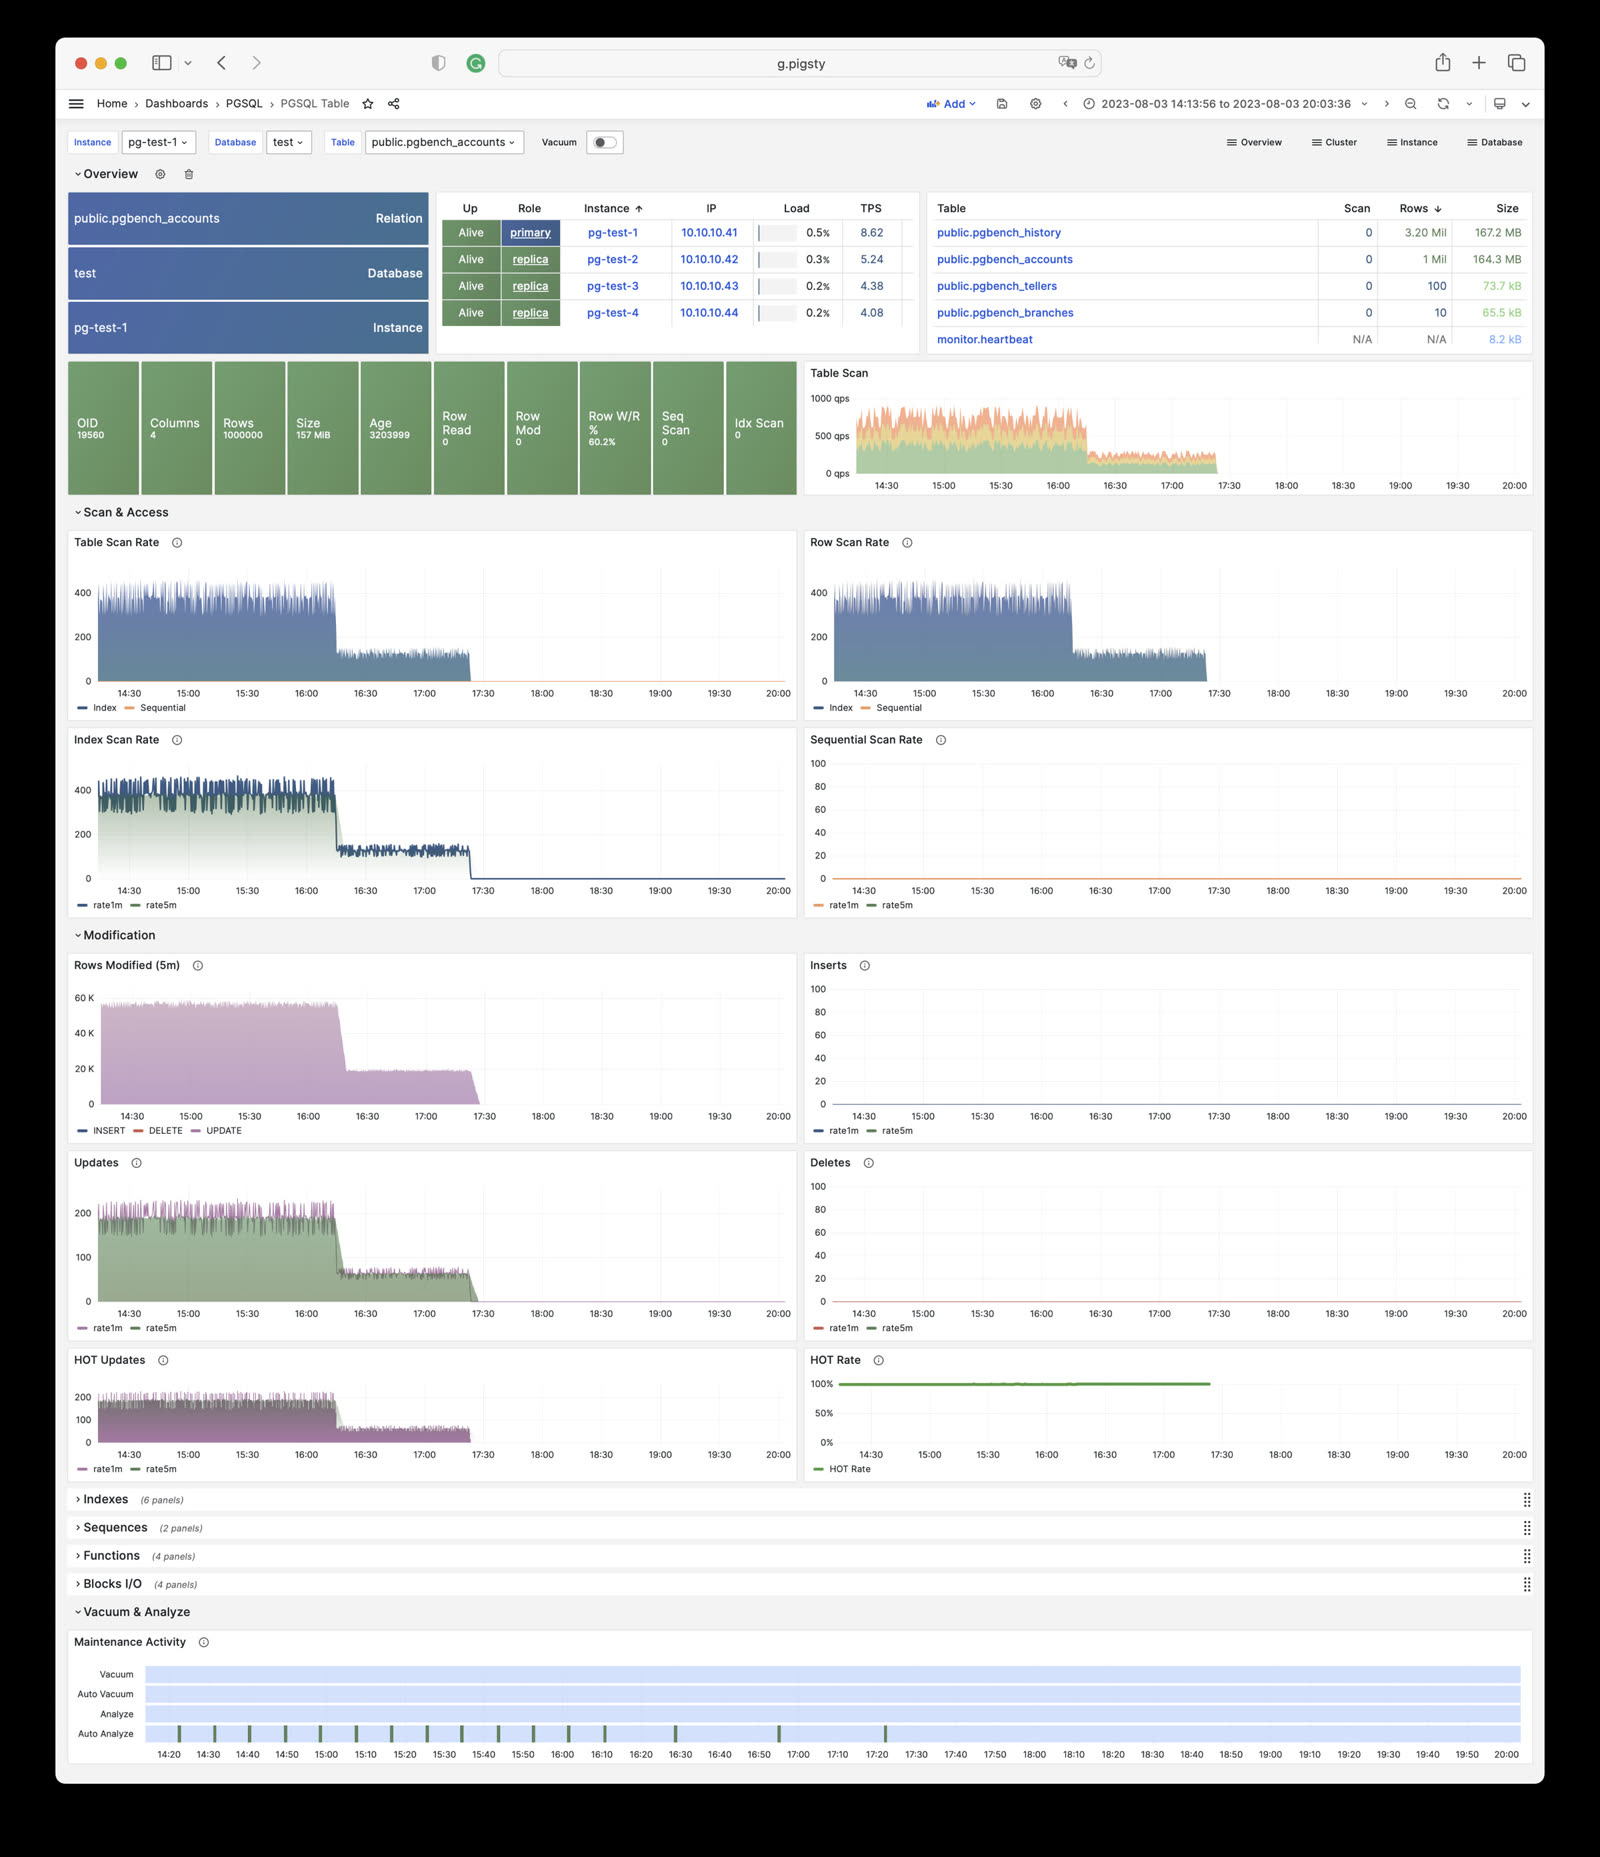
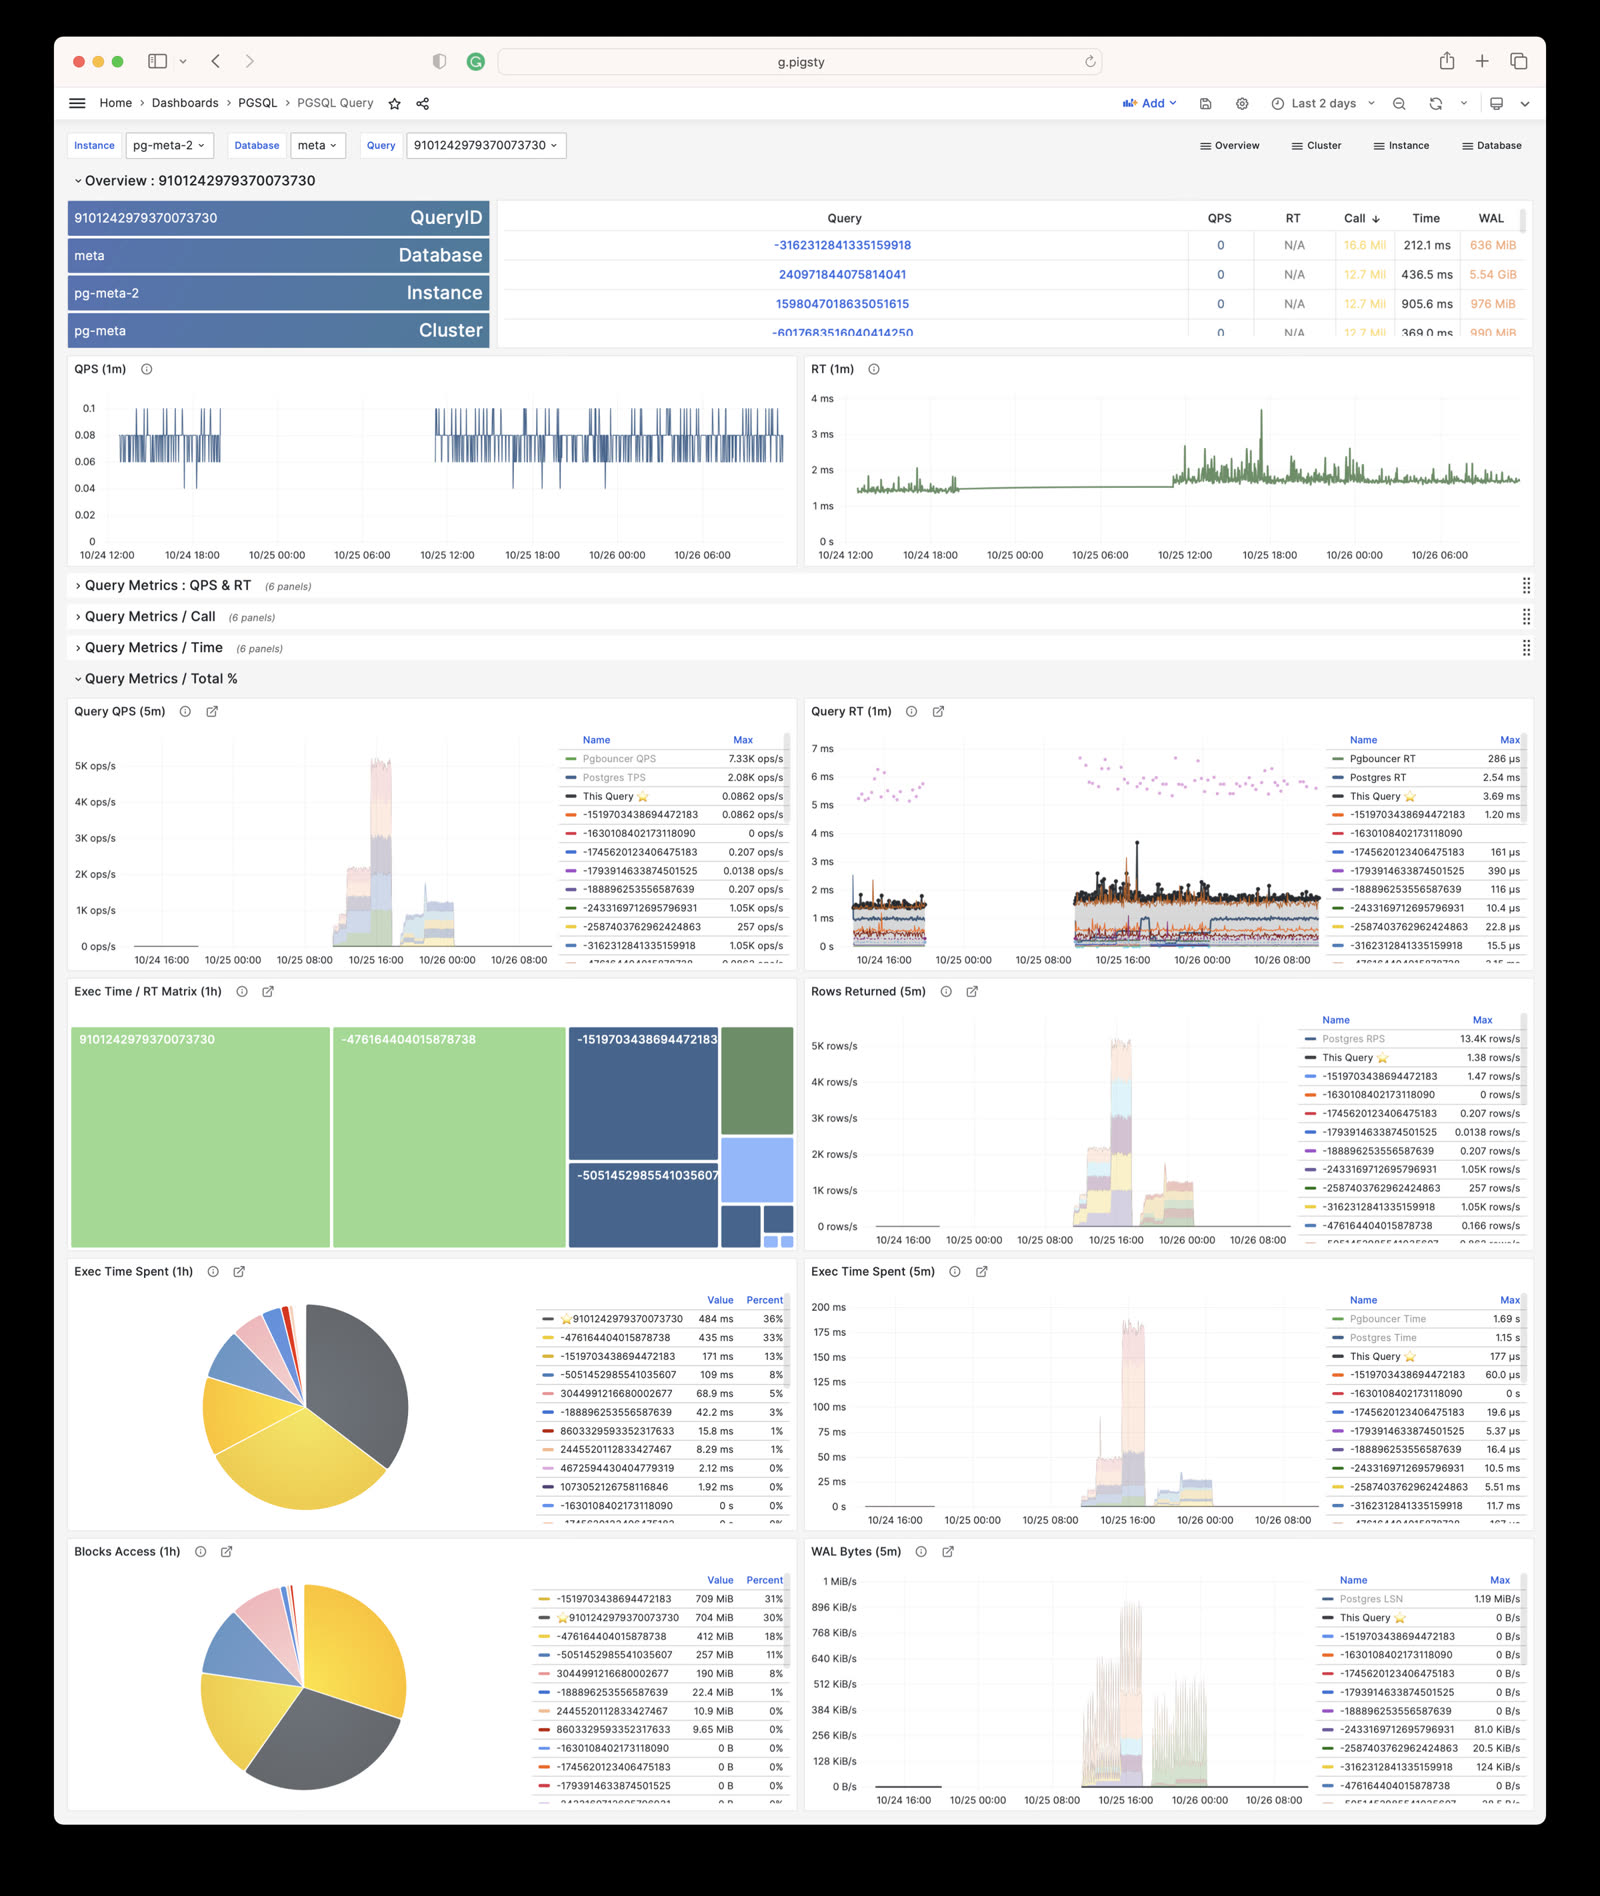
  • Battery-included Grafana dashboards showcasing all aspects of PostgreSQL

Metrics

PostgreSQL monitoring metrics are fully defined by the pg_exporter configuration file: pg_exporter.yml 
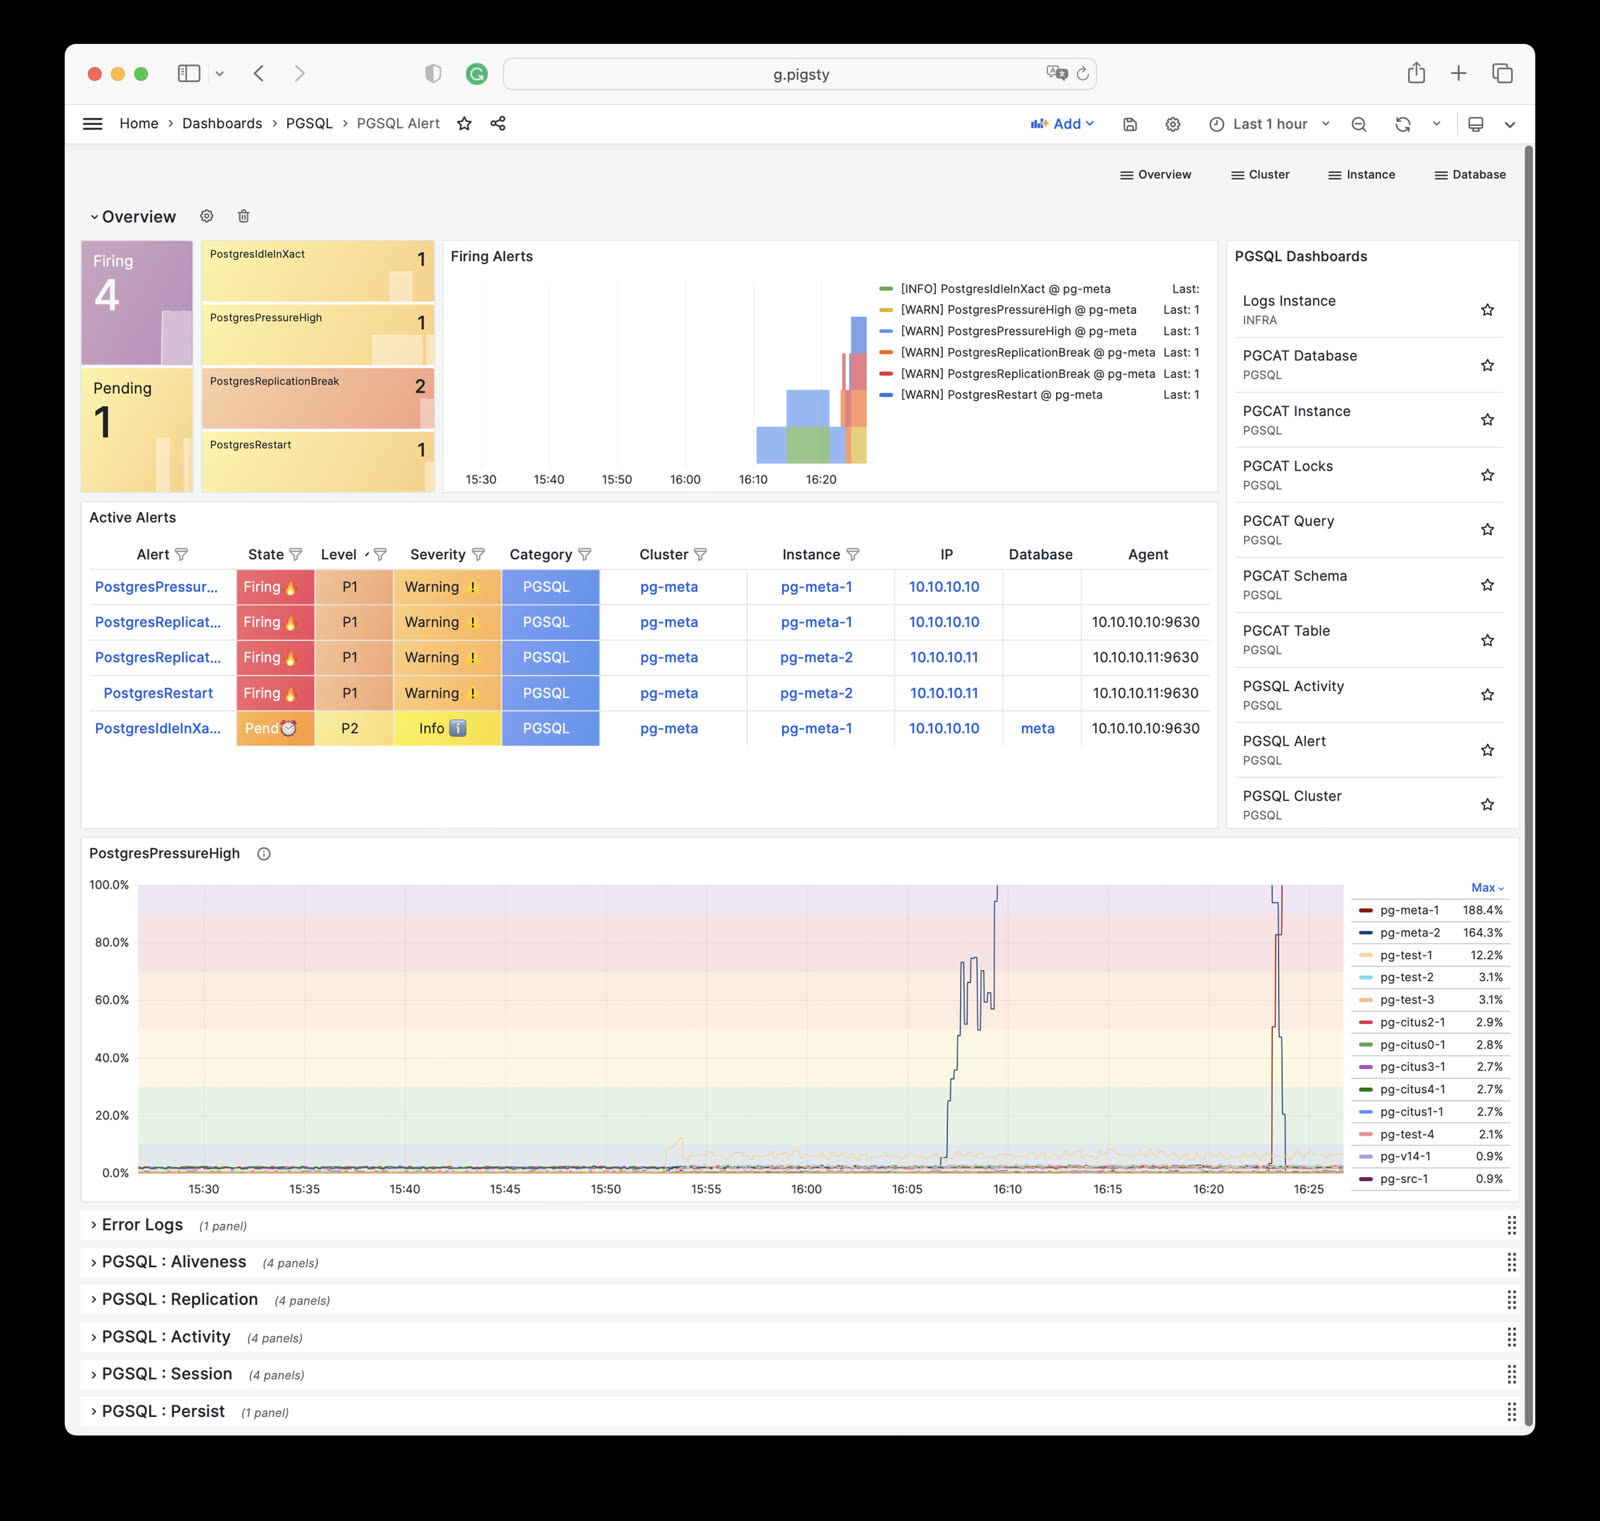
They are further processed by Prometheus recording rules and alert rules: files/prometheus/rules/pgsql.yml.

Pigsty uses three identity labels: cls, ins, ip, which are attached to all metrics and logs. Additionally, metrics from Pgbouncer, host nodes (NODE), and load balancers are also used by Pigsty, with the same labels used whenever possible for correlation analysis.

{ cls: pg-meta, ins: pg-meta-1, ip: 10.10.10.10 }
{ cls: pg-meta, ins: pg-test-1, ip: 10.10.10.11 }
{ cls: pg-meta, ins: pg-test-2, ip: 10.10.10.12 }
{ cls: pg-meta, ins: pg-test-3, ip: 10.10.10.13 }
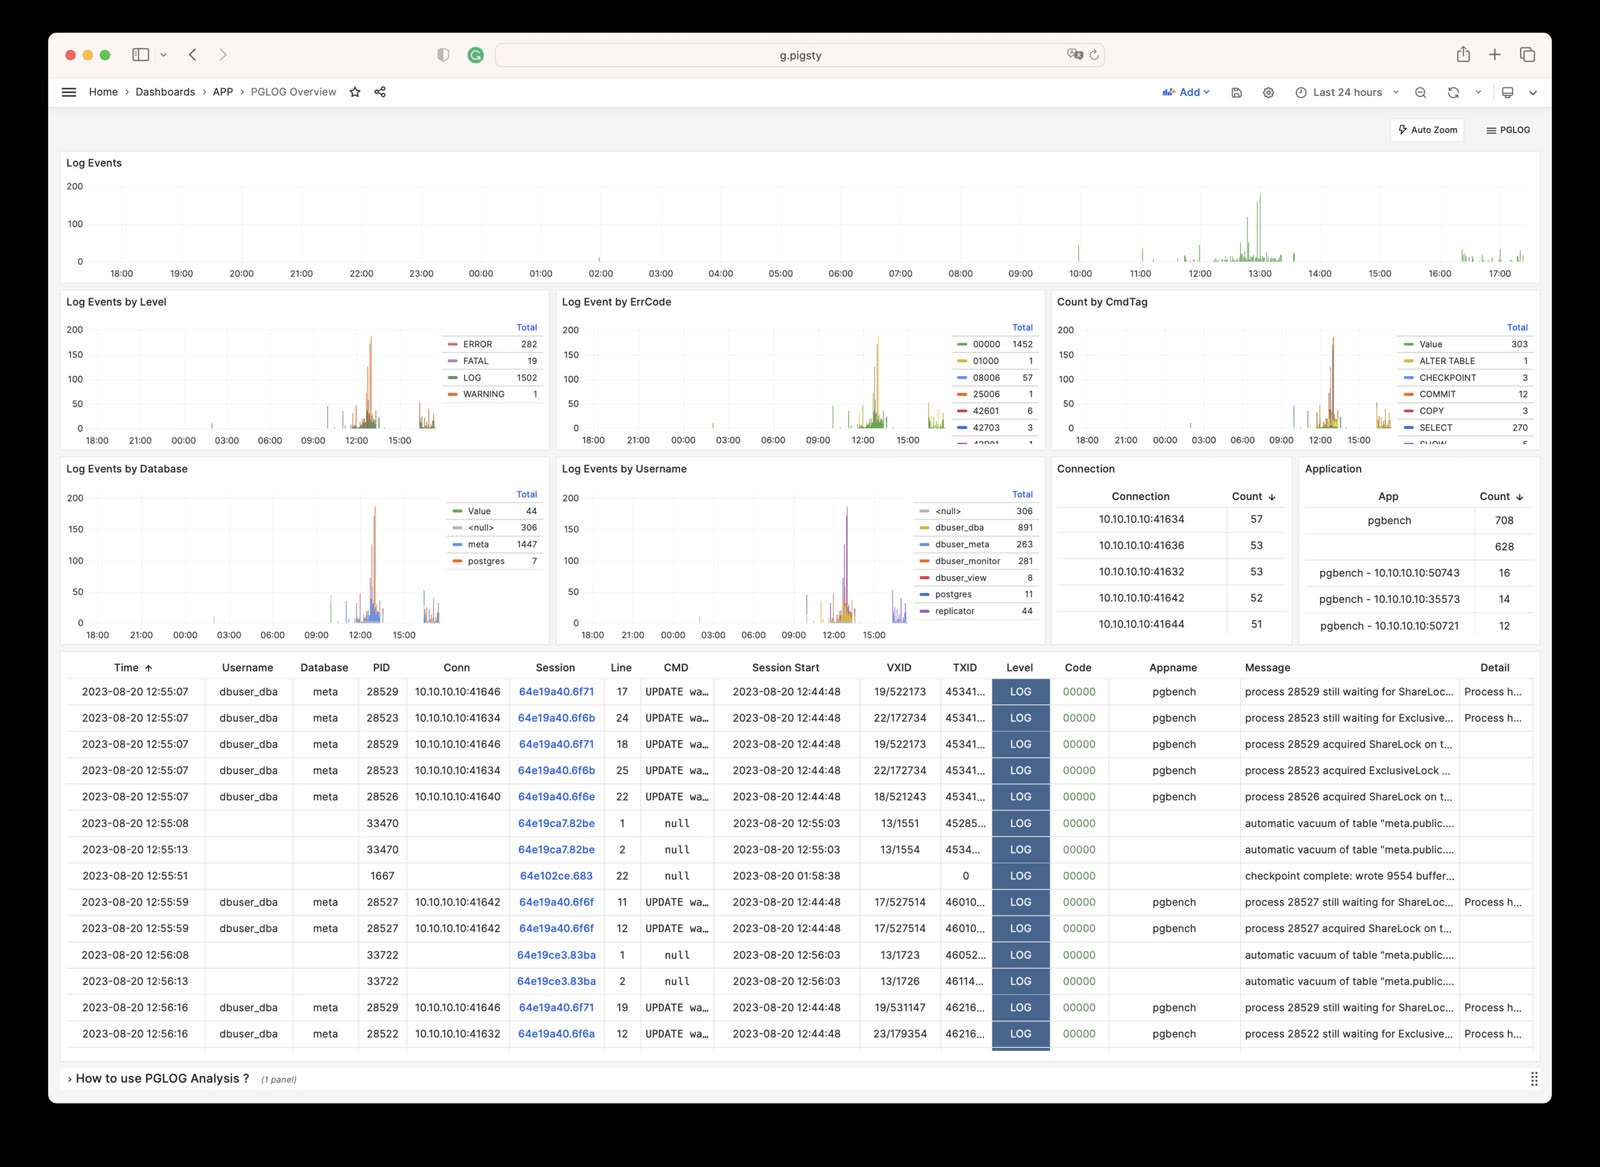
Logs

PostgreSQL-related logs are collected by Vector and sent to the VictoriaLogs log storage/query service on infra nodes.

Target Management

Prometheus monitoring targets are defined in static files under /etc/prometheus/targets/pgsql/, with each instance having a corresponding file. Taking pg-meta-1 as an example:

# pg-meta-1 [primary] @ 10.10.10.10
- labels: { cls: pg-meta, ins: pg-meta-1, ip: 10.10.10.10 }
  targets:
    - 10.10.10.10:9630    # <--- pg_exporter for PostgreSQL metrics
    - 10.10.10.10:9631    # <--- pg_exporter for pgbouncer metrics
    - 10.10.10.10:8008    # <--- patroni metrics (when API SSL is not enabled)

When the global flag patroni_ssl_enabled is set, patroni targets will be moved to a separate file /etc/prometheus/targets/patroni/<ins>.yml, as it uses the https scrape endpoint. When monitoring RDS instances, monitoring targets are placed separately in the /etc/prometheus/targets/pgrds/ directory and managed by cluster.

When removing a cluster using bin/pgsql-rm or pgsql-rm.yml, the Prometheus monitoring targets will be removed. You can also remove them manually or use subtasks from the playbook:

bin/pgmon-rm <cls|ins>    # Remove prometheus monitoring targets from all infra nodes

Remote RDS monitoring targets are placed in /etc/prometheus/targets/pgrds/<cls>.yml, created by the pgsql-monitor.yml playbook or bin/pgmon-add script.


Monitoring Modes

Pigsty provides three monitoring modes to suit different monitoring needs.

Item \ LevelL1L2L3
NameBasicManagedStandard
AbbrRDSMANAGEDFULL
ScenarioConnection string only, e.g., RDSExisting DB, nodes manageableInstances created by Pigsty
PGCAT Features✅ Fully Available✅ Fully Available✅ Fully Available
PGSQL Features✅ PG metrics only✅ PG & node metrics only✅ Full Features
Connection Pool Metrics❌ Not Available⚠️ Optional✅ Pre-installed
Load Balancer Metrics❌ Not Available⚠️ Optional✅ Pre-installed
PGLOG Features❌ Not Available⚠️ Optional✅ Pre-installed
PG Exporter⚠️ On infra nodes✅ On DB nodes✅ On DB nodes
Node Exporter❌ Not deployed✅ On DB nodes✅ On DB nodes
Intrusiveness✅ Non-intrusive⚠️ Install Exporter⚠️ Fully managed by Pigsty
Monitor Existing Instances✅ Supported✅ Supported❌ For Pigsty-managed only
Monitoring Users & ViewsManual setupManual setupAuto-created by Pigsty
Deployment Playbookbin/pgmon-add <cls>Partial pgsql.yml/node.ymlpgsql.yml
Required PermissionsConnectable PGURL from infraSSH & sudo on DB nodesSSH & sudo on DB nodes
Feature SummaryPGCAT + PGRDSMost featuresFull features

Databases fully managed by Pigsty are automatically monitored with the best support and typically require no configuration. For existing PostgreSQL clusters or RDS services, if the target DB nodes can be managed by Pigsty (ssh accessible, sudo available), you can consider managed deployment for a monitoring experience similar to native Pigsty. If you can only access the target database via PGURL (database connection string), such as remote RDS services, you can use basic mode to monitor the target database.


Monitor Existing Cluster

If the target DB nodes can be managed by Pigsty (ssh accessible and sudo available), you can use the pg_exporter task in the pgsql.yml playbook to deploy monitoring components (PG Exporter) on target nodes in the same way as standard deployments. You can also use the pgbouncer and pgbouncer_exporter tasks from that playbook to deploy connection pools and their monitoring on existing instance nodes. Additionally, you can use node_exporter, haproxy, and vector from node.yml to deploy host monitoring, load balancing, and log collection components, achieving an experience identical to native Pigsty database instances.

The definition method for existing clusters is exactly the same as for clusters managed by Pigsty. You selectively execute partial tasks from the pgsql.yml playbook instead of running the entire playbook.

./node.yml  -l <cls> -t node_repo,node_pkg           # Add YUM repos from INFRA nodes and install packages on host nodes
./node.yml  -l <cls> -t node_exporter,node_register  # Configure host monitoring and add to VictoriaMetrics
./node.yml  -l <cls> -t vector                       # Configure host log collection and send to VictoriaLogs
./pgsql.yml -l <cls> -t pg_exporter,pg_register      # Configure PostgreSQL monitoring and register with VictoriaMetrics/Grafana

Since the target database cluster already exists, you need to manually create monitoring users, schemas, and extensions on the target database cluster.


Monitor RDS

If you can only access the target database via PGURL (database connection string), you can configure according to the instructions here. In this mode, Pigsty deploys corresponding PG Exporters on INFRA nodes to scrape remote database metrics, as shown below:

------ infra ------
|                 |
|   prometheus    |            v---- pg-foo-1 ----v
|       ^         |  metrics   |         ^        |
|   pg_exporter <-|------------|----  postgres    |
|   (port: 20001) |            | 10.10.10.10:5432 |
|       ^         |            ^------------------^
|       ^         |                      ^
|       ^         |            v---- pg-foo-2 ----v
|       ^         |  metrics   |         ^        |
|   pg_exporter <-|------------|----  postgres    |
|   (port: 20002) |            | 10.10.10.11:5433 |
-------------------            ^------------------^

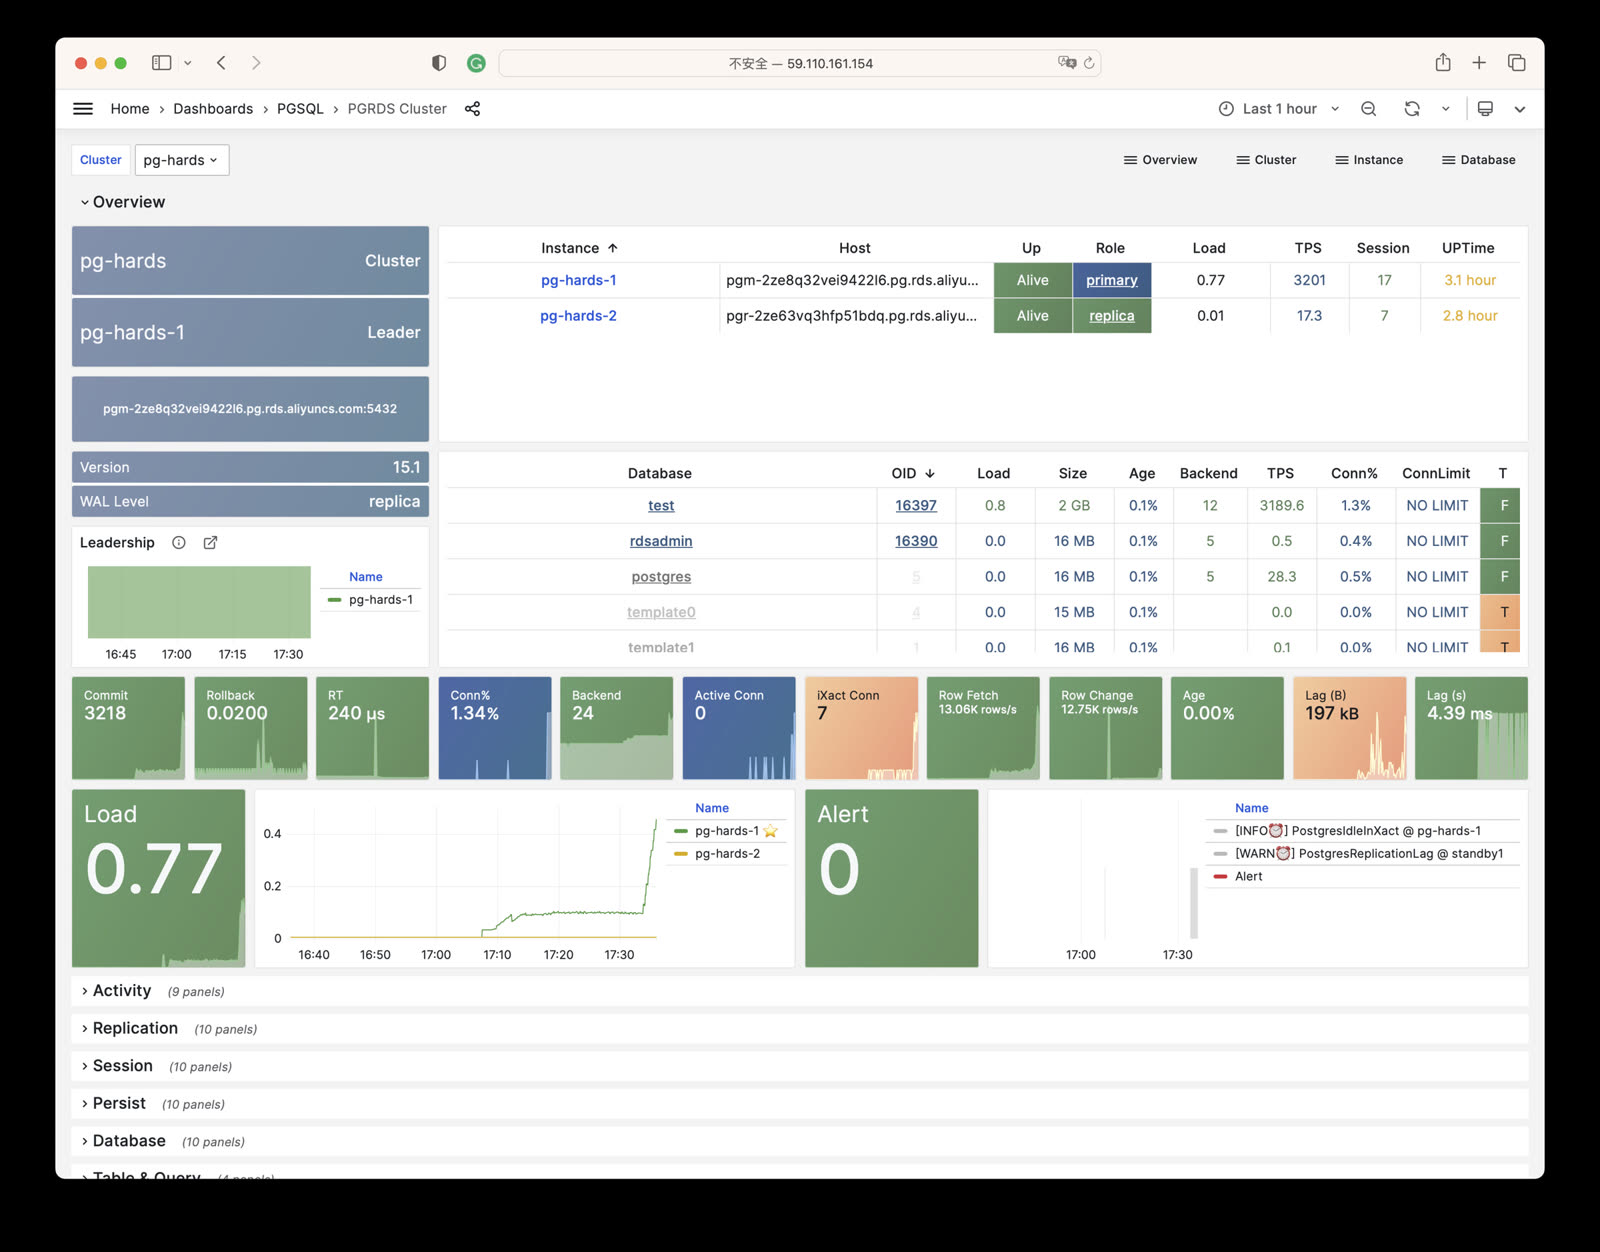
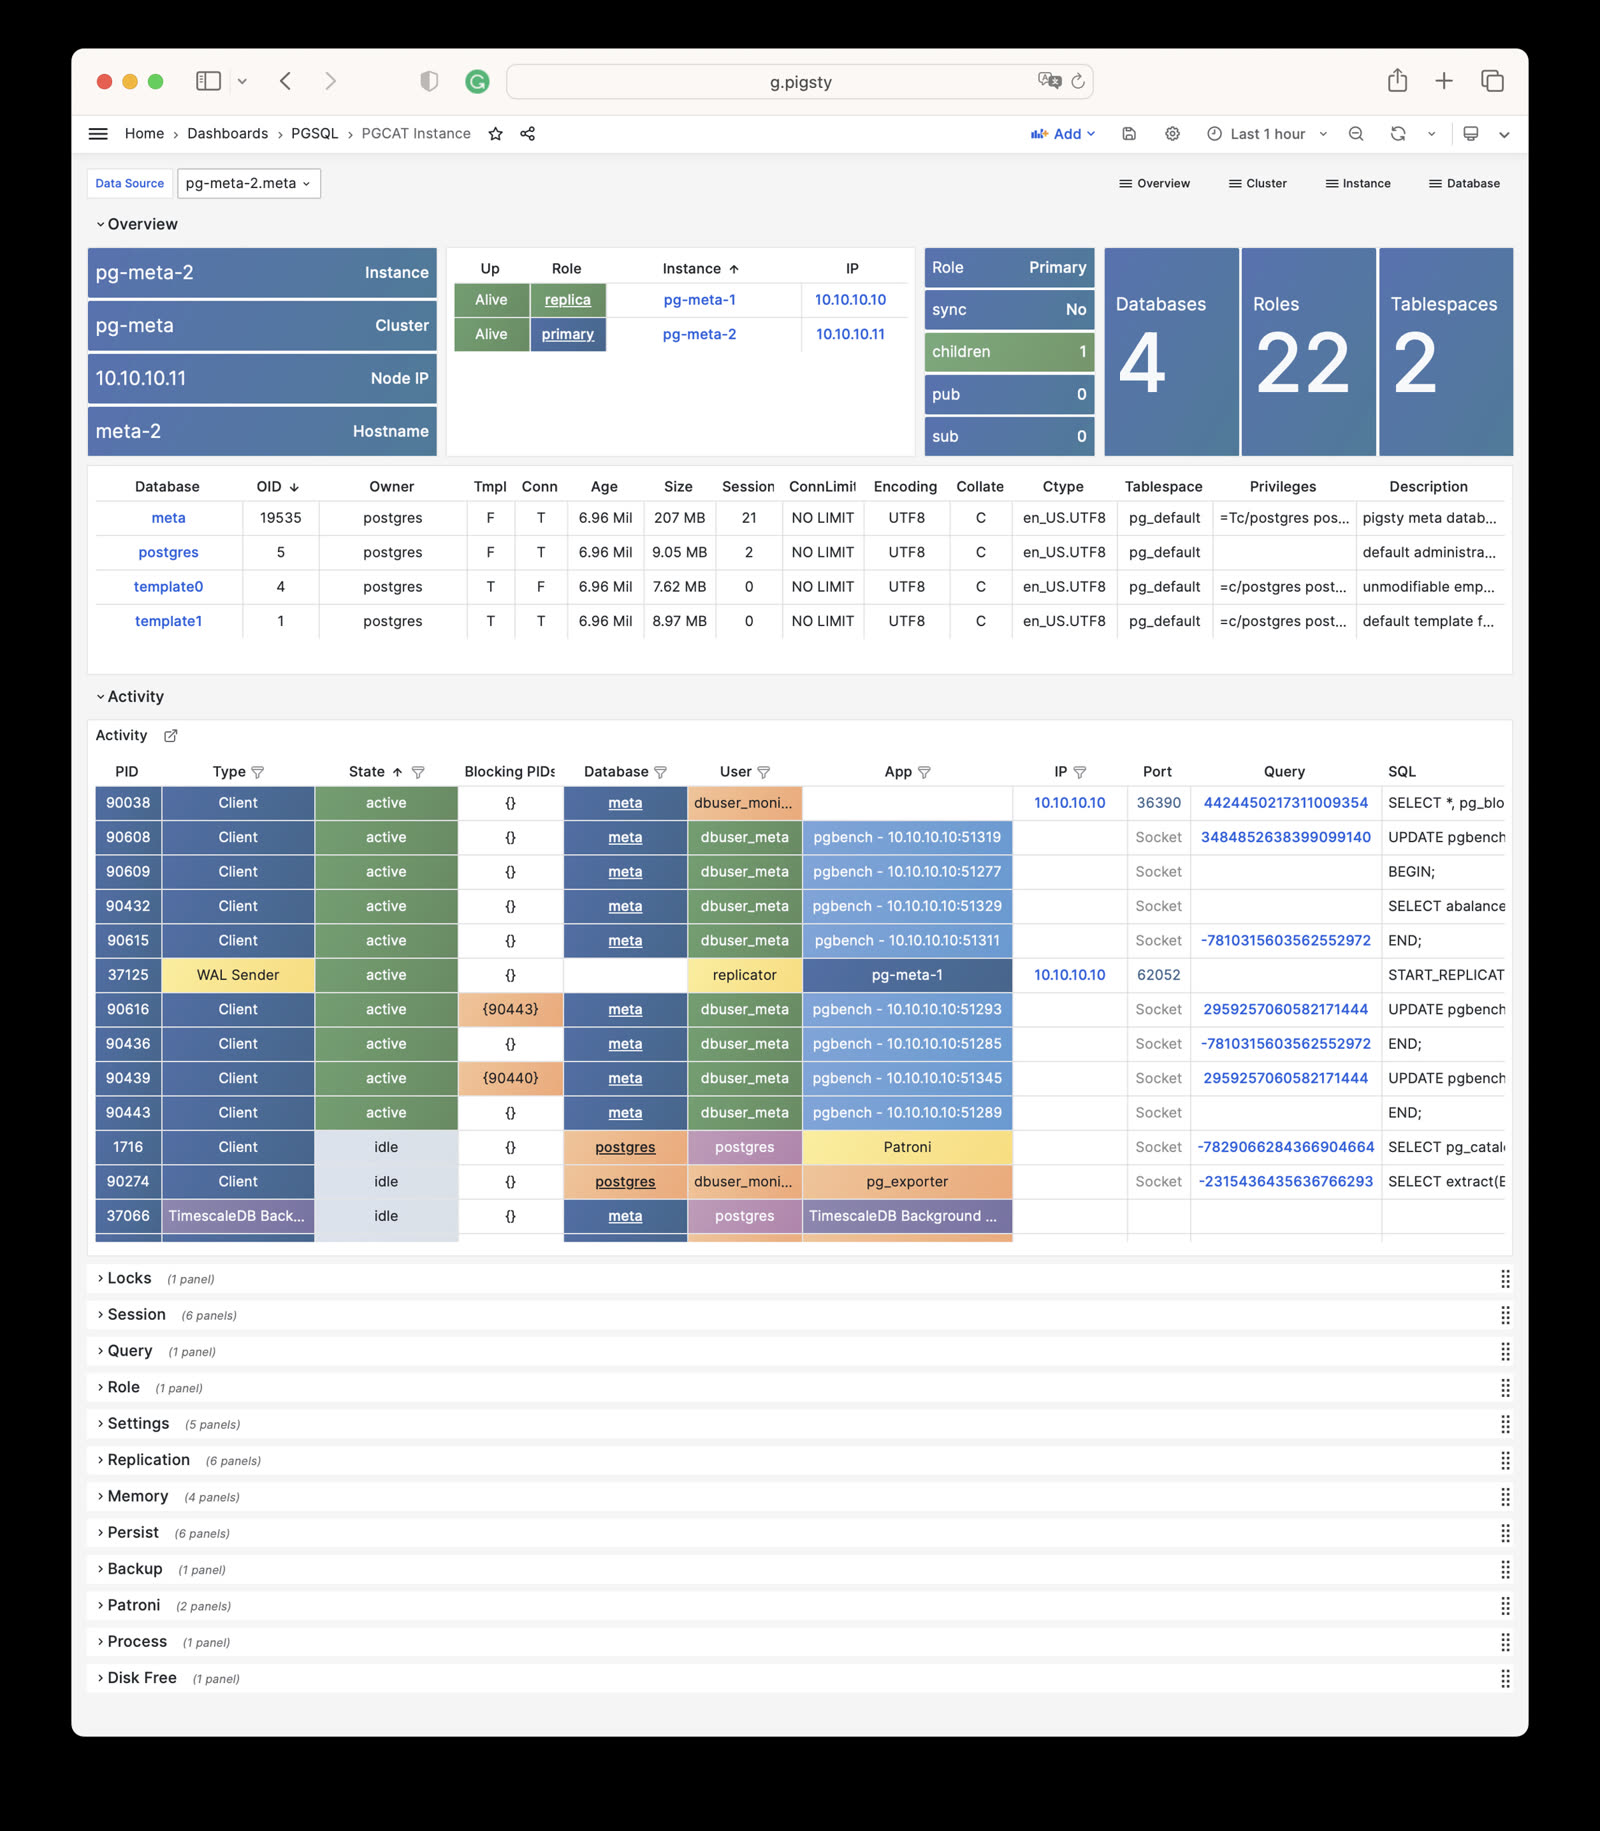
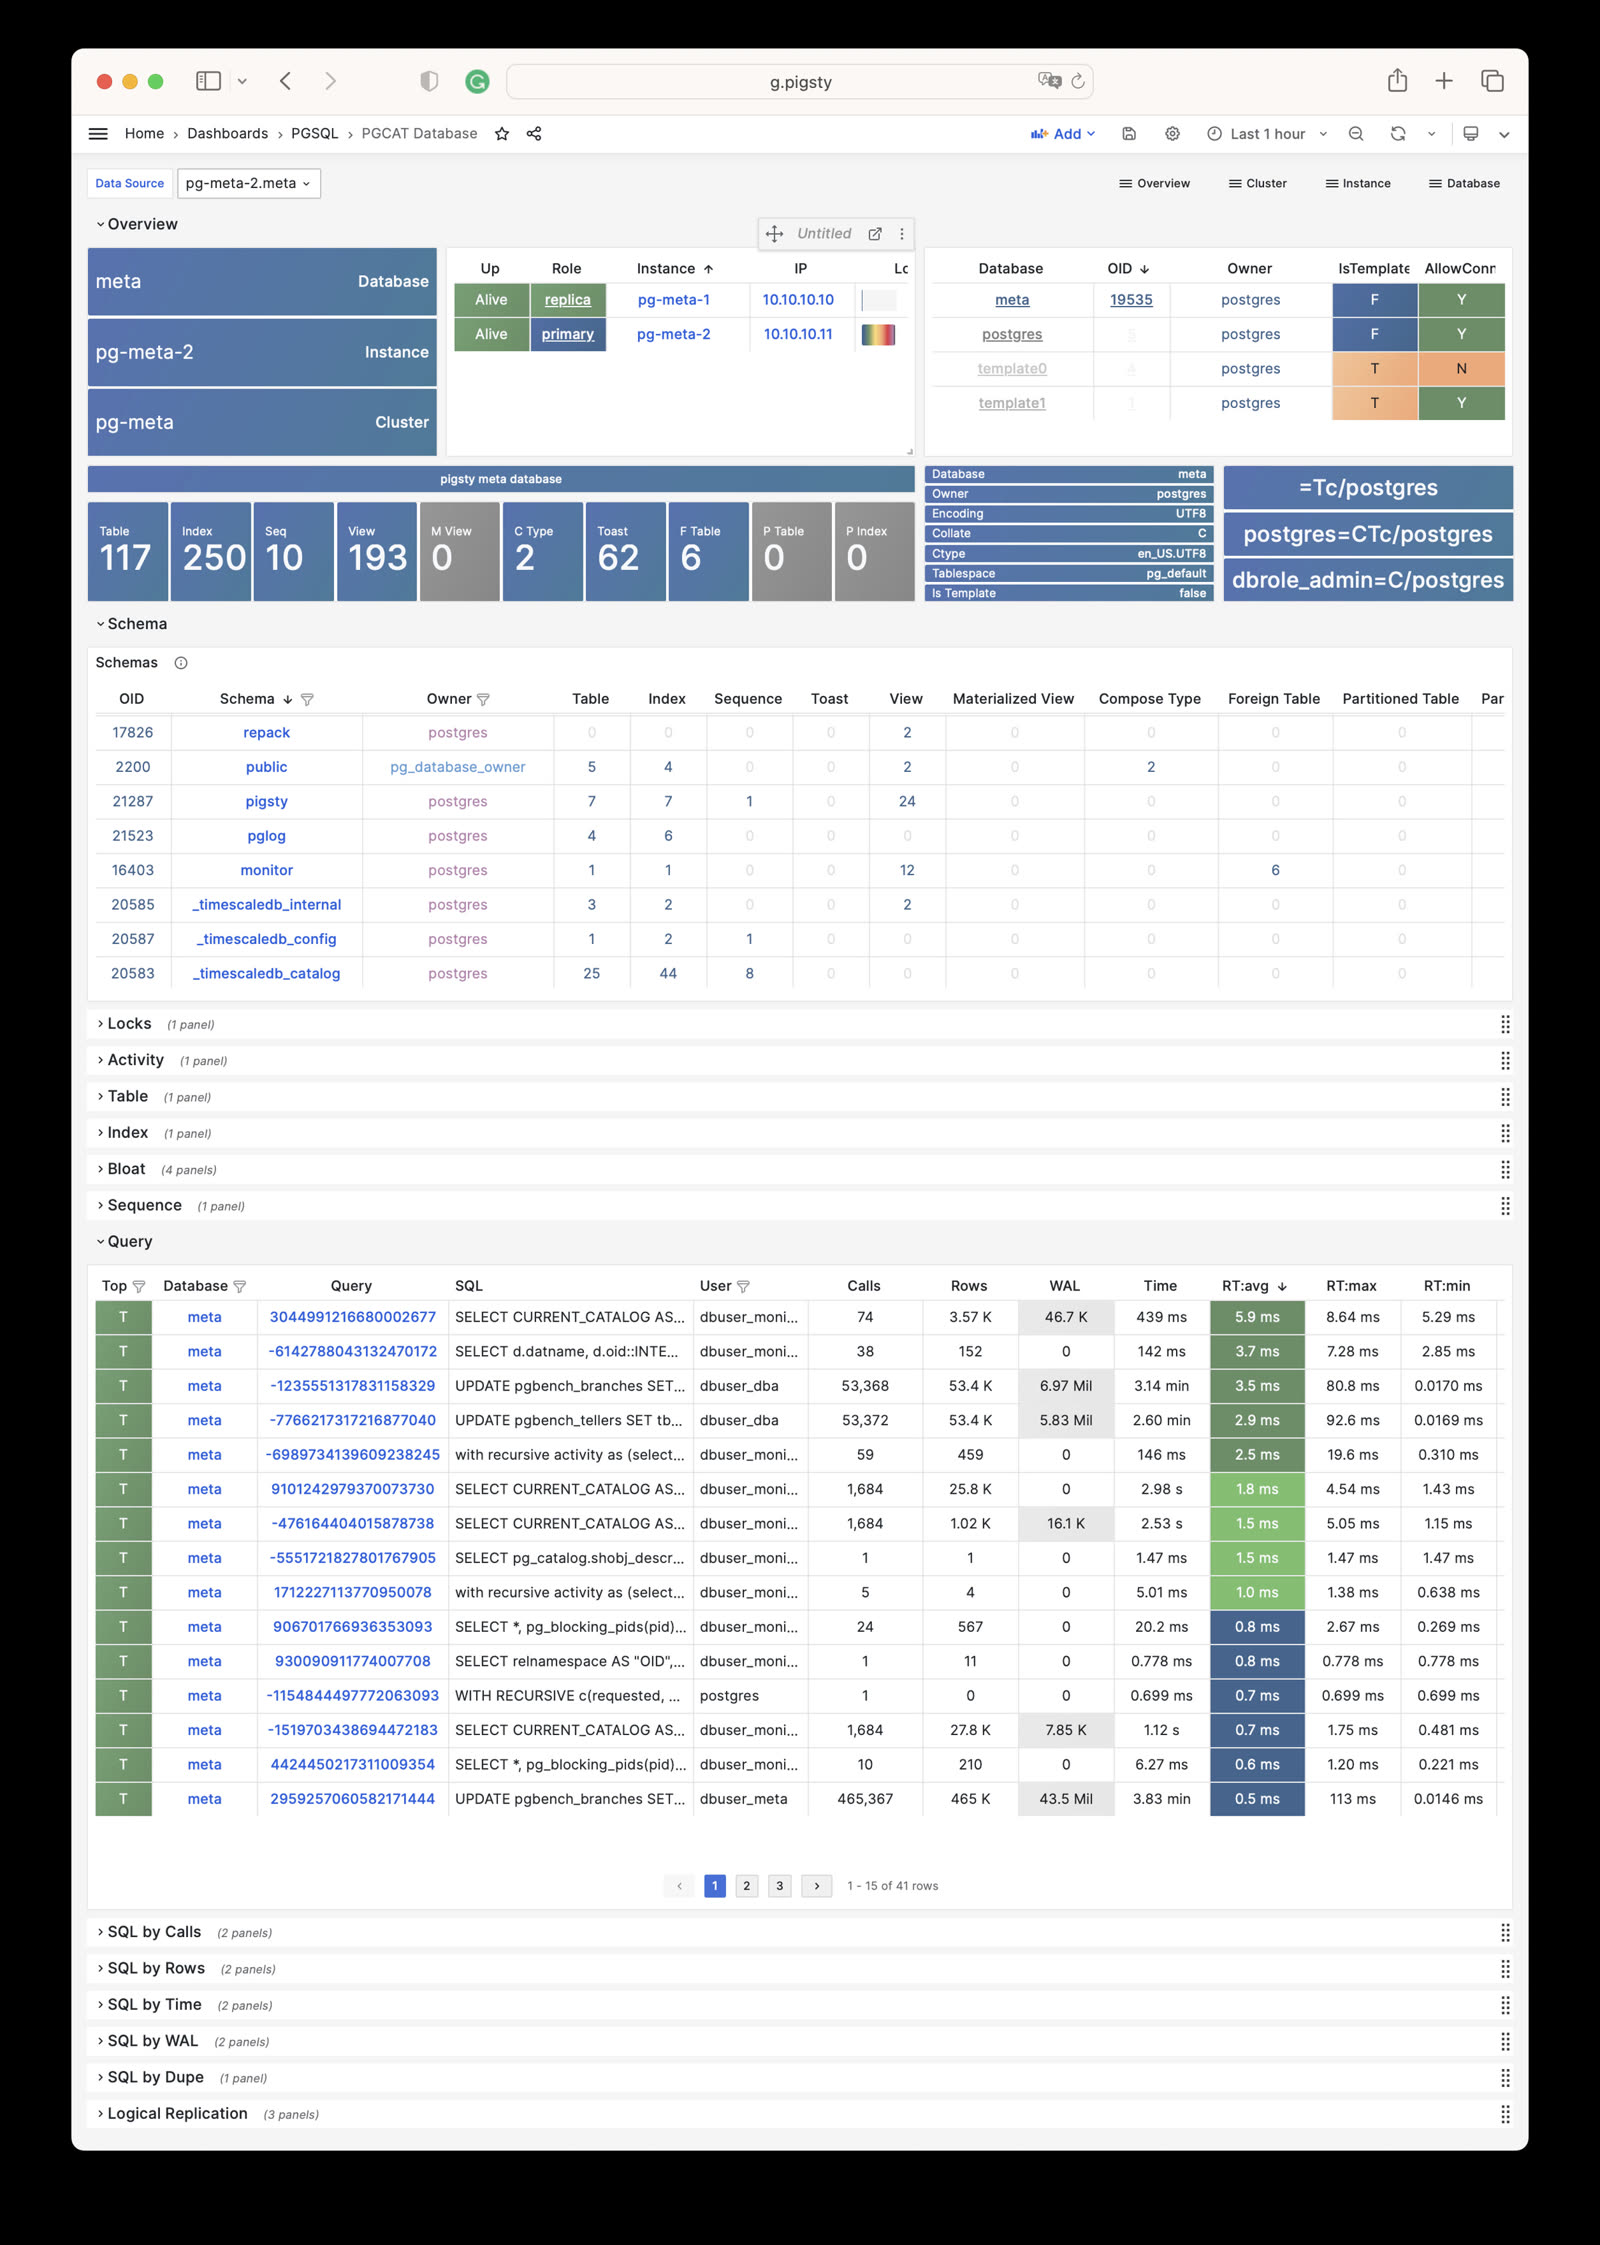
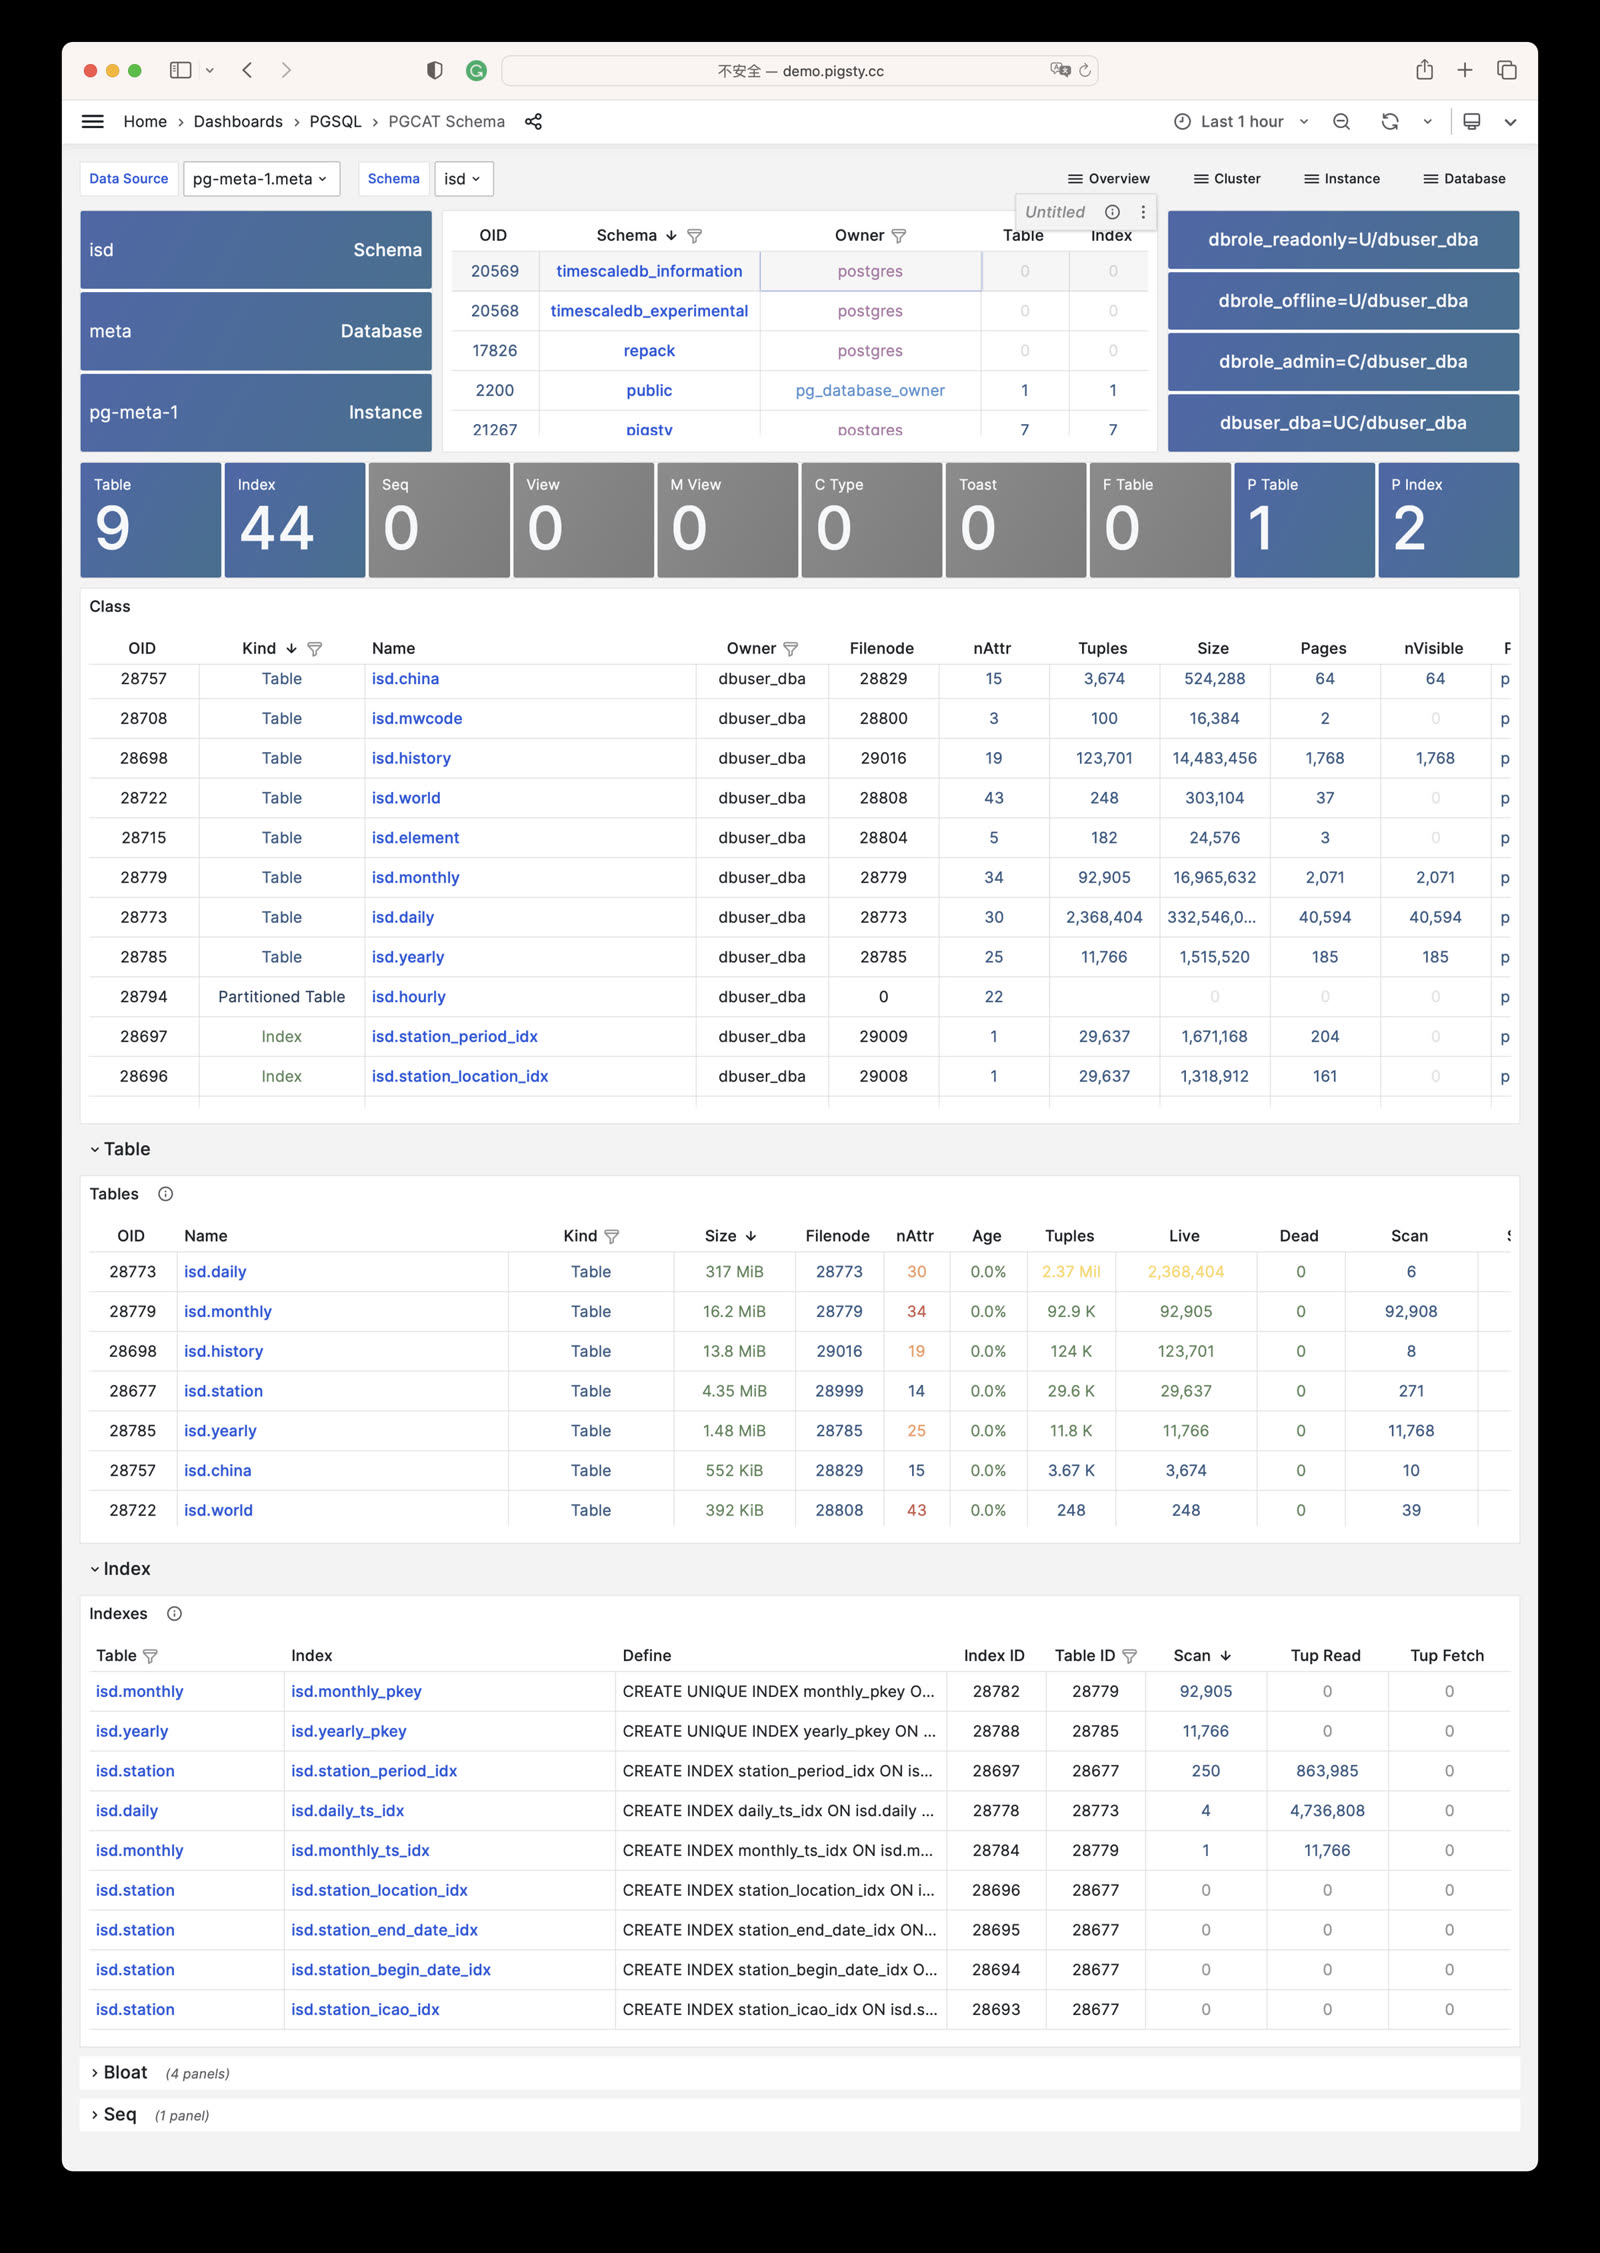
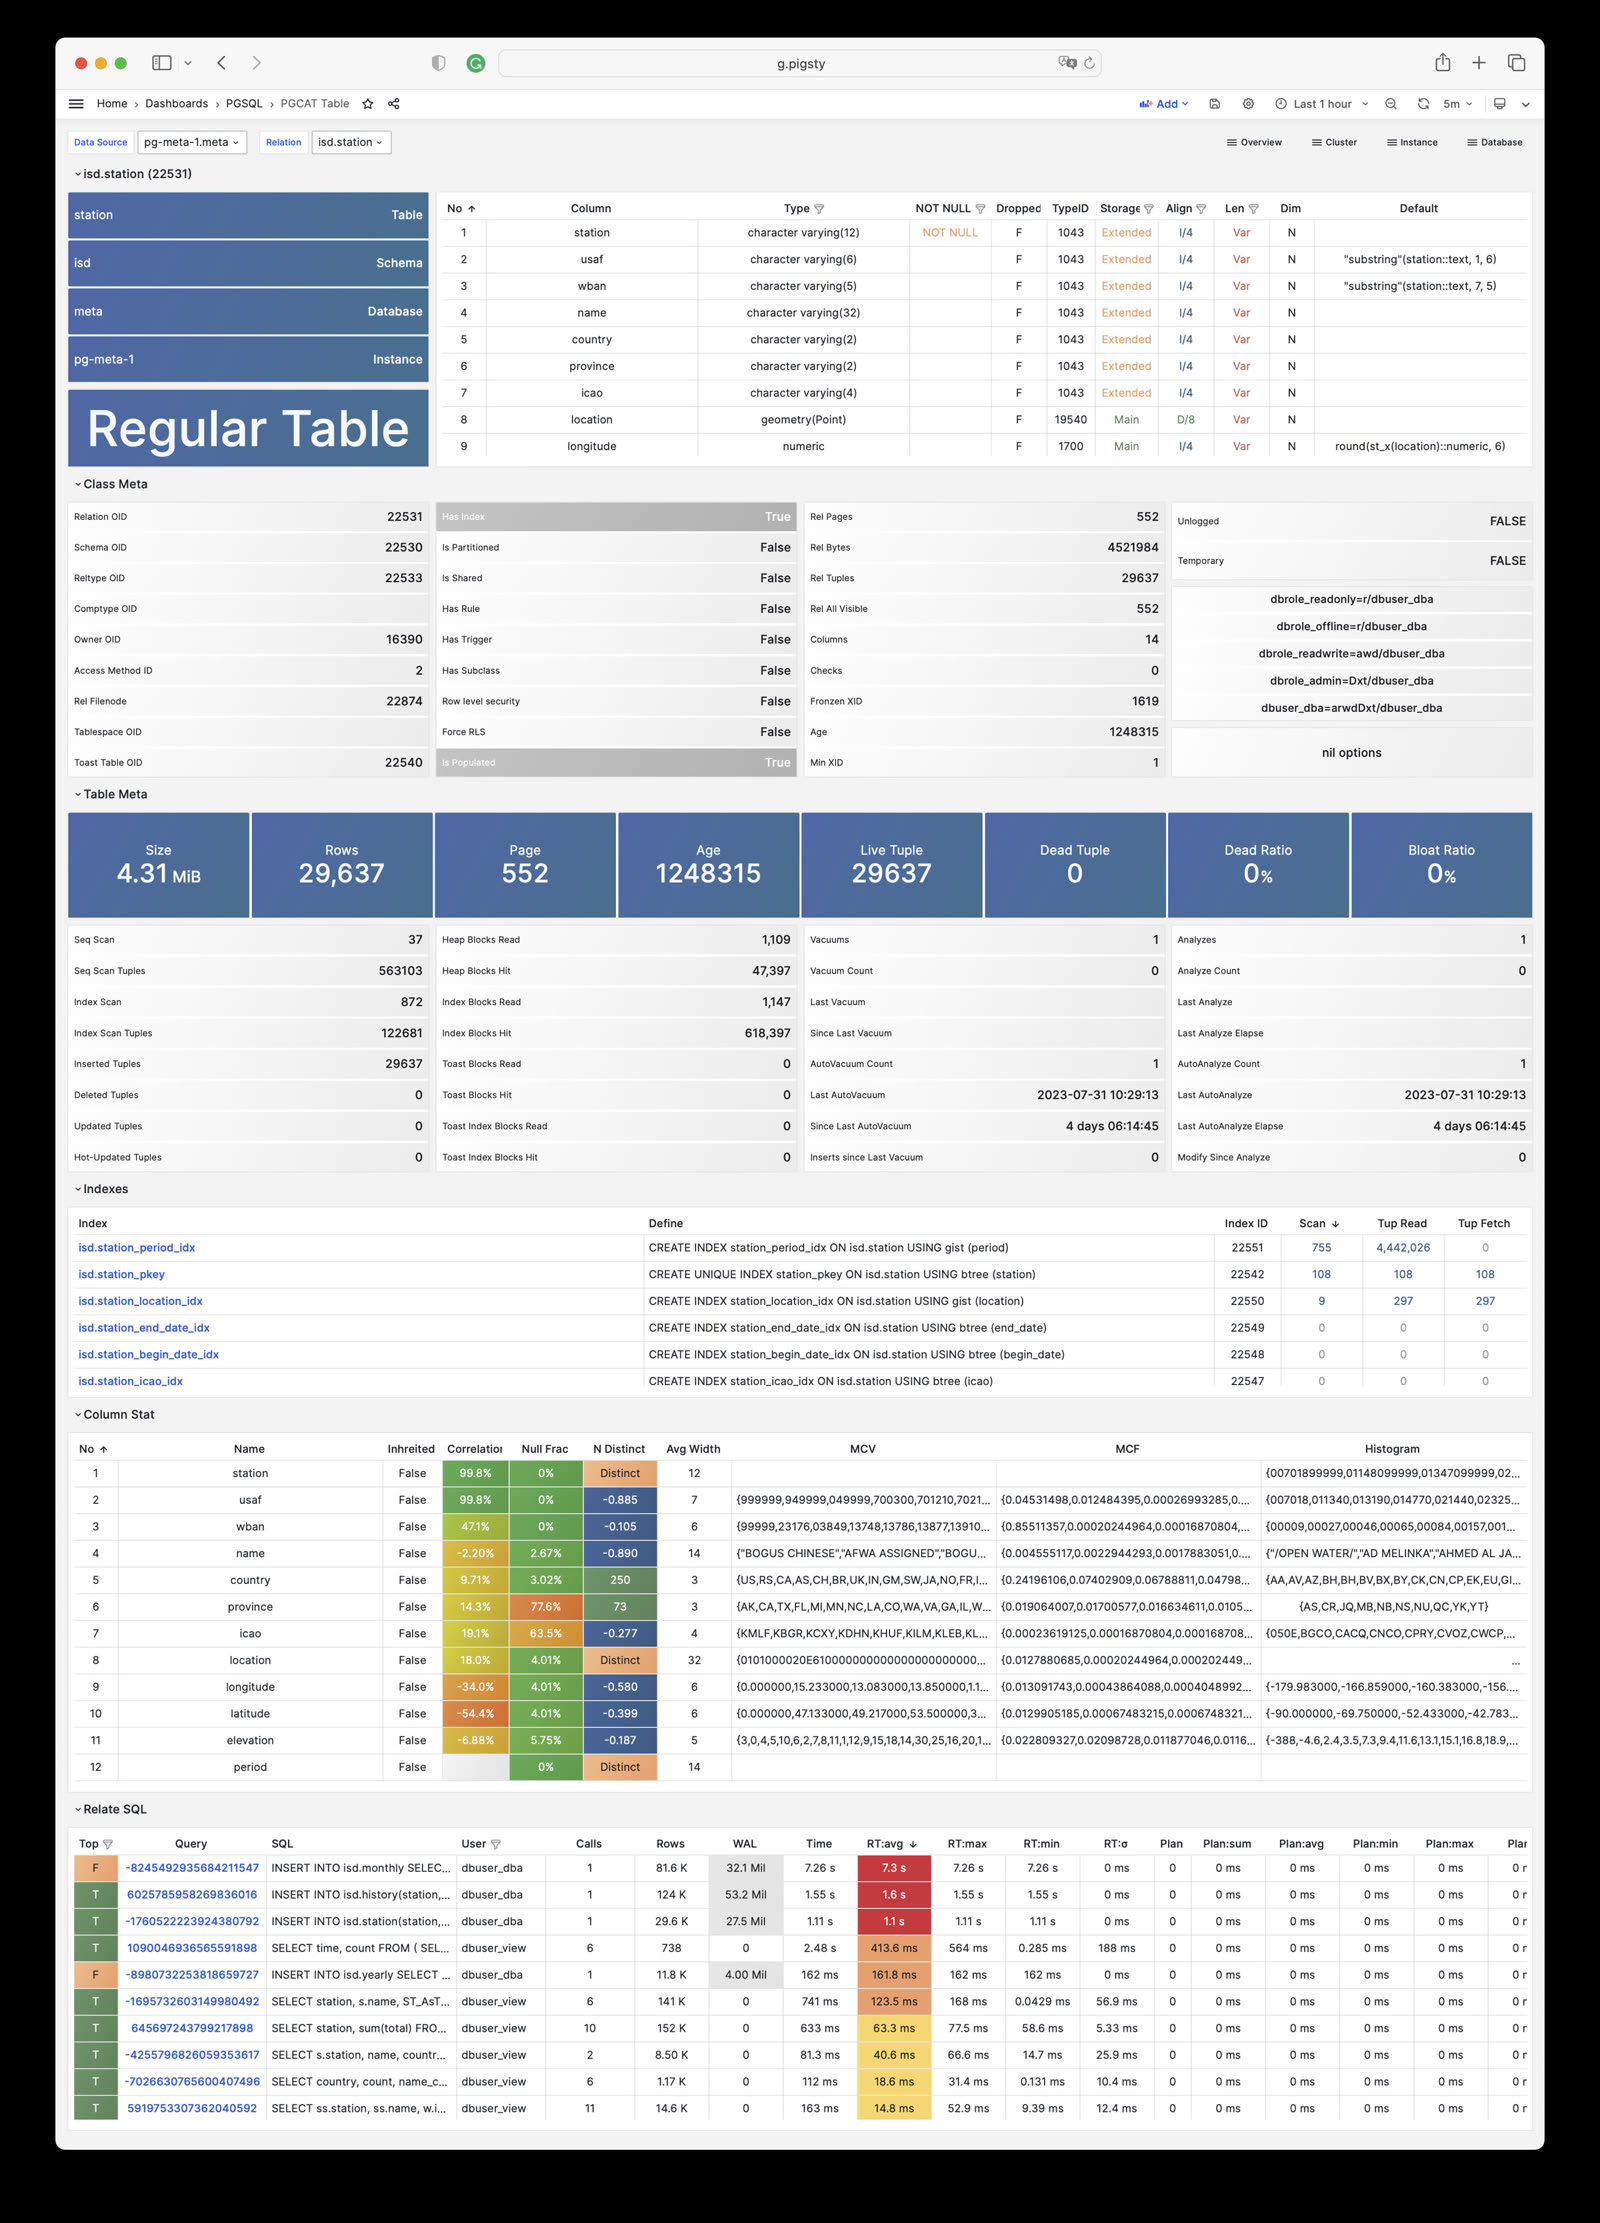
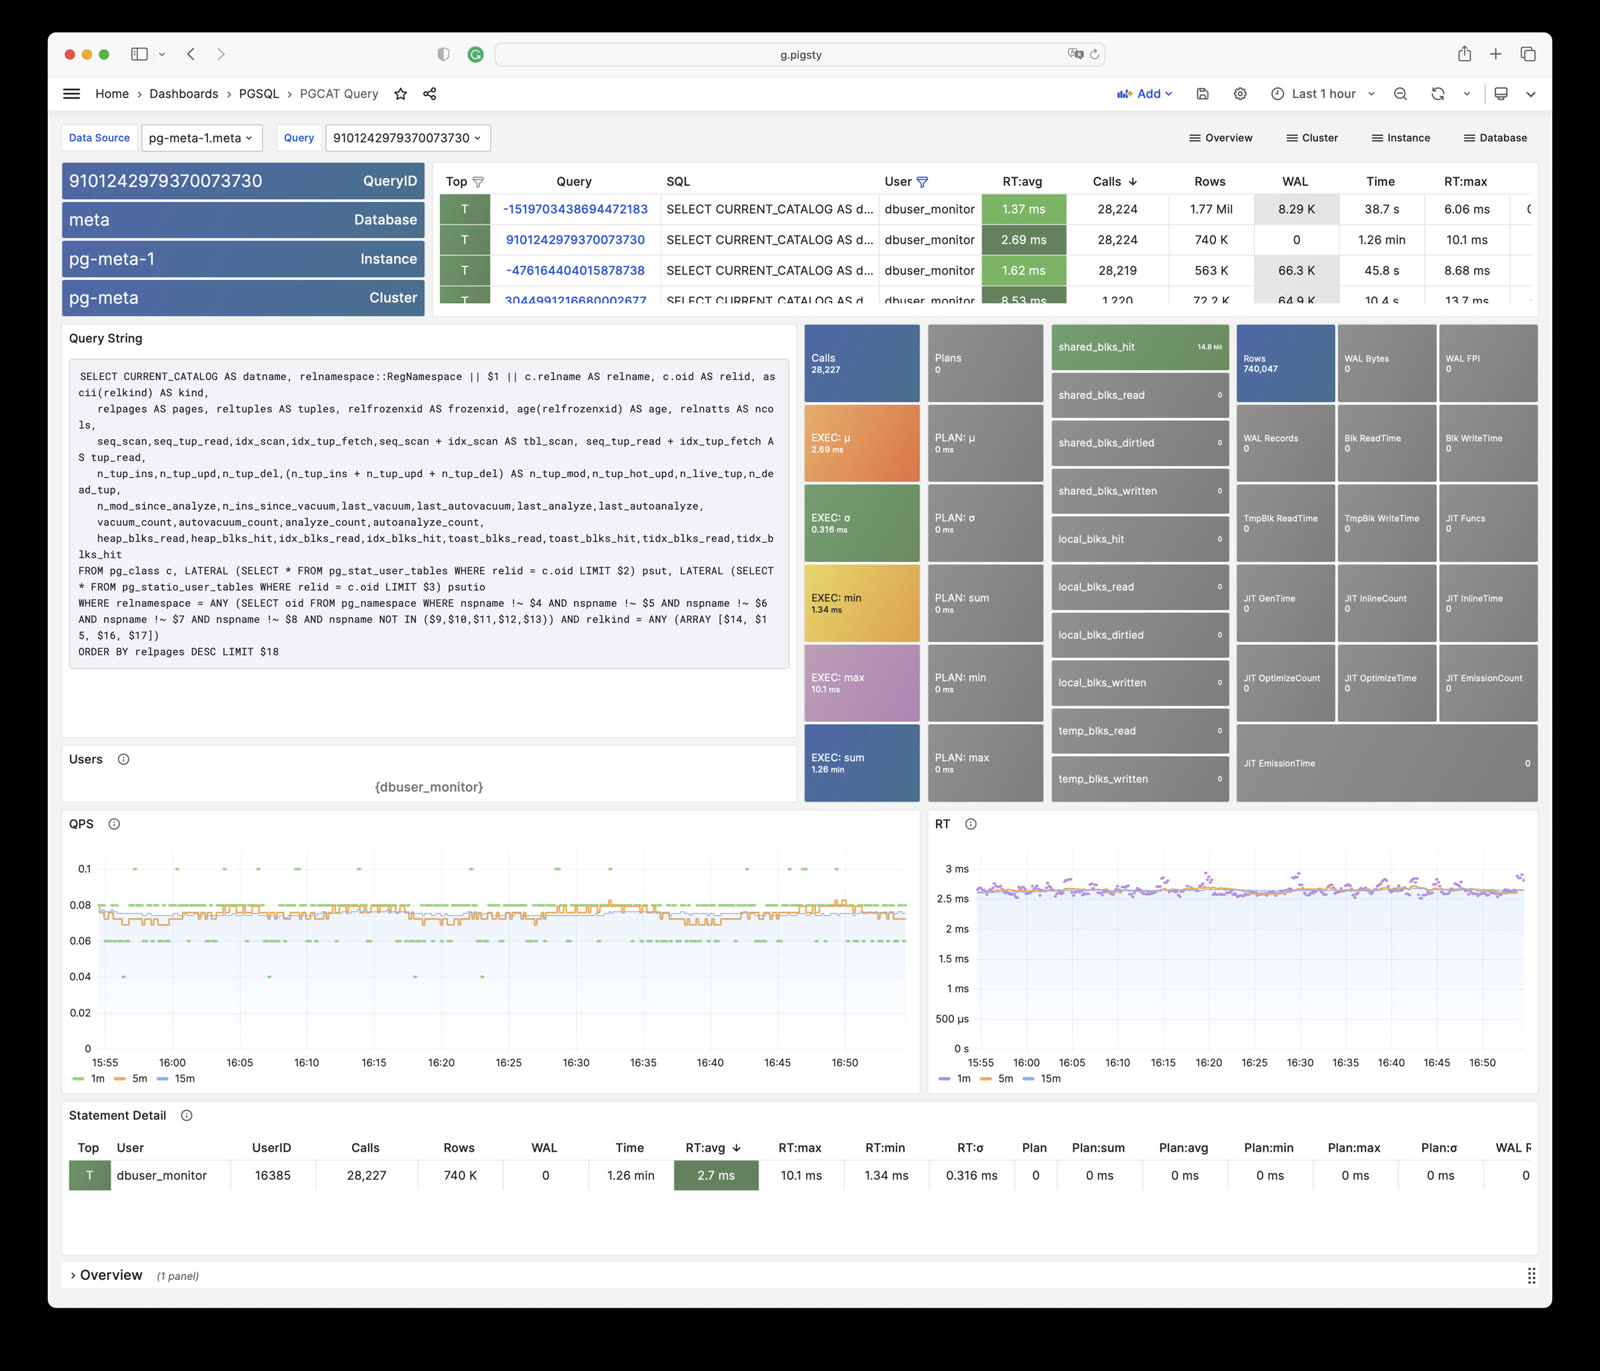
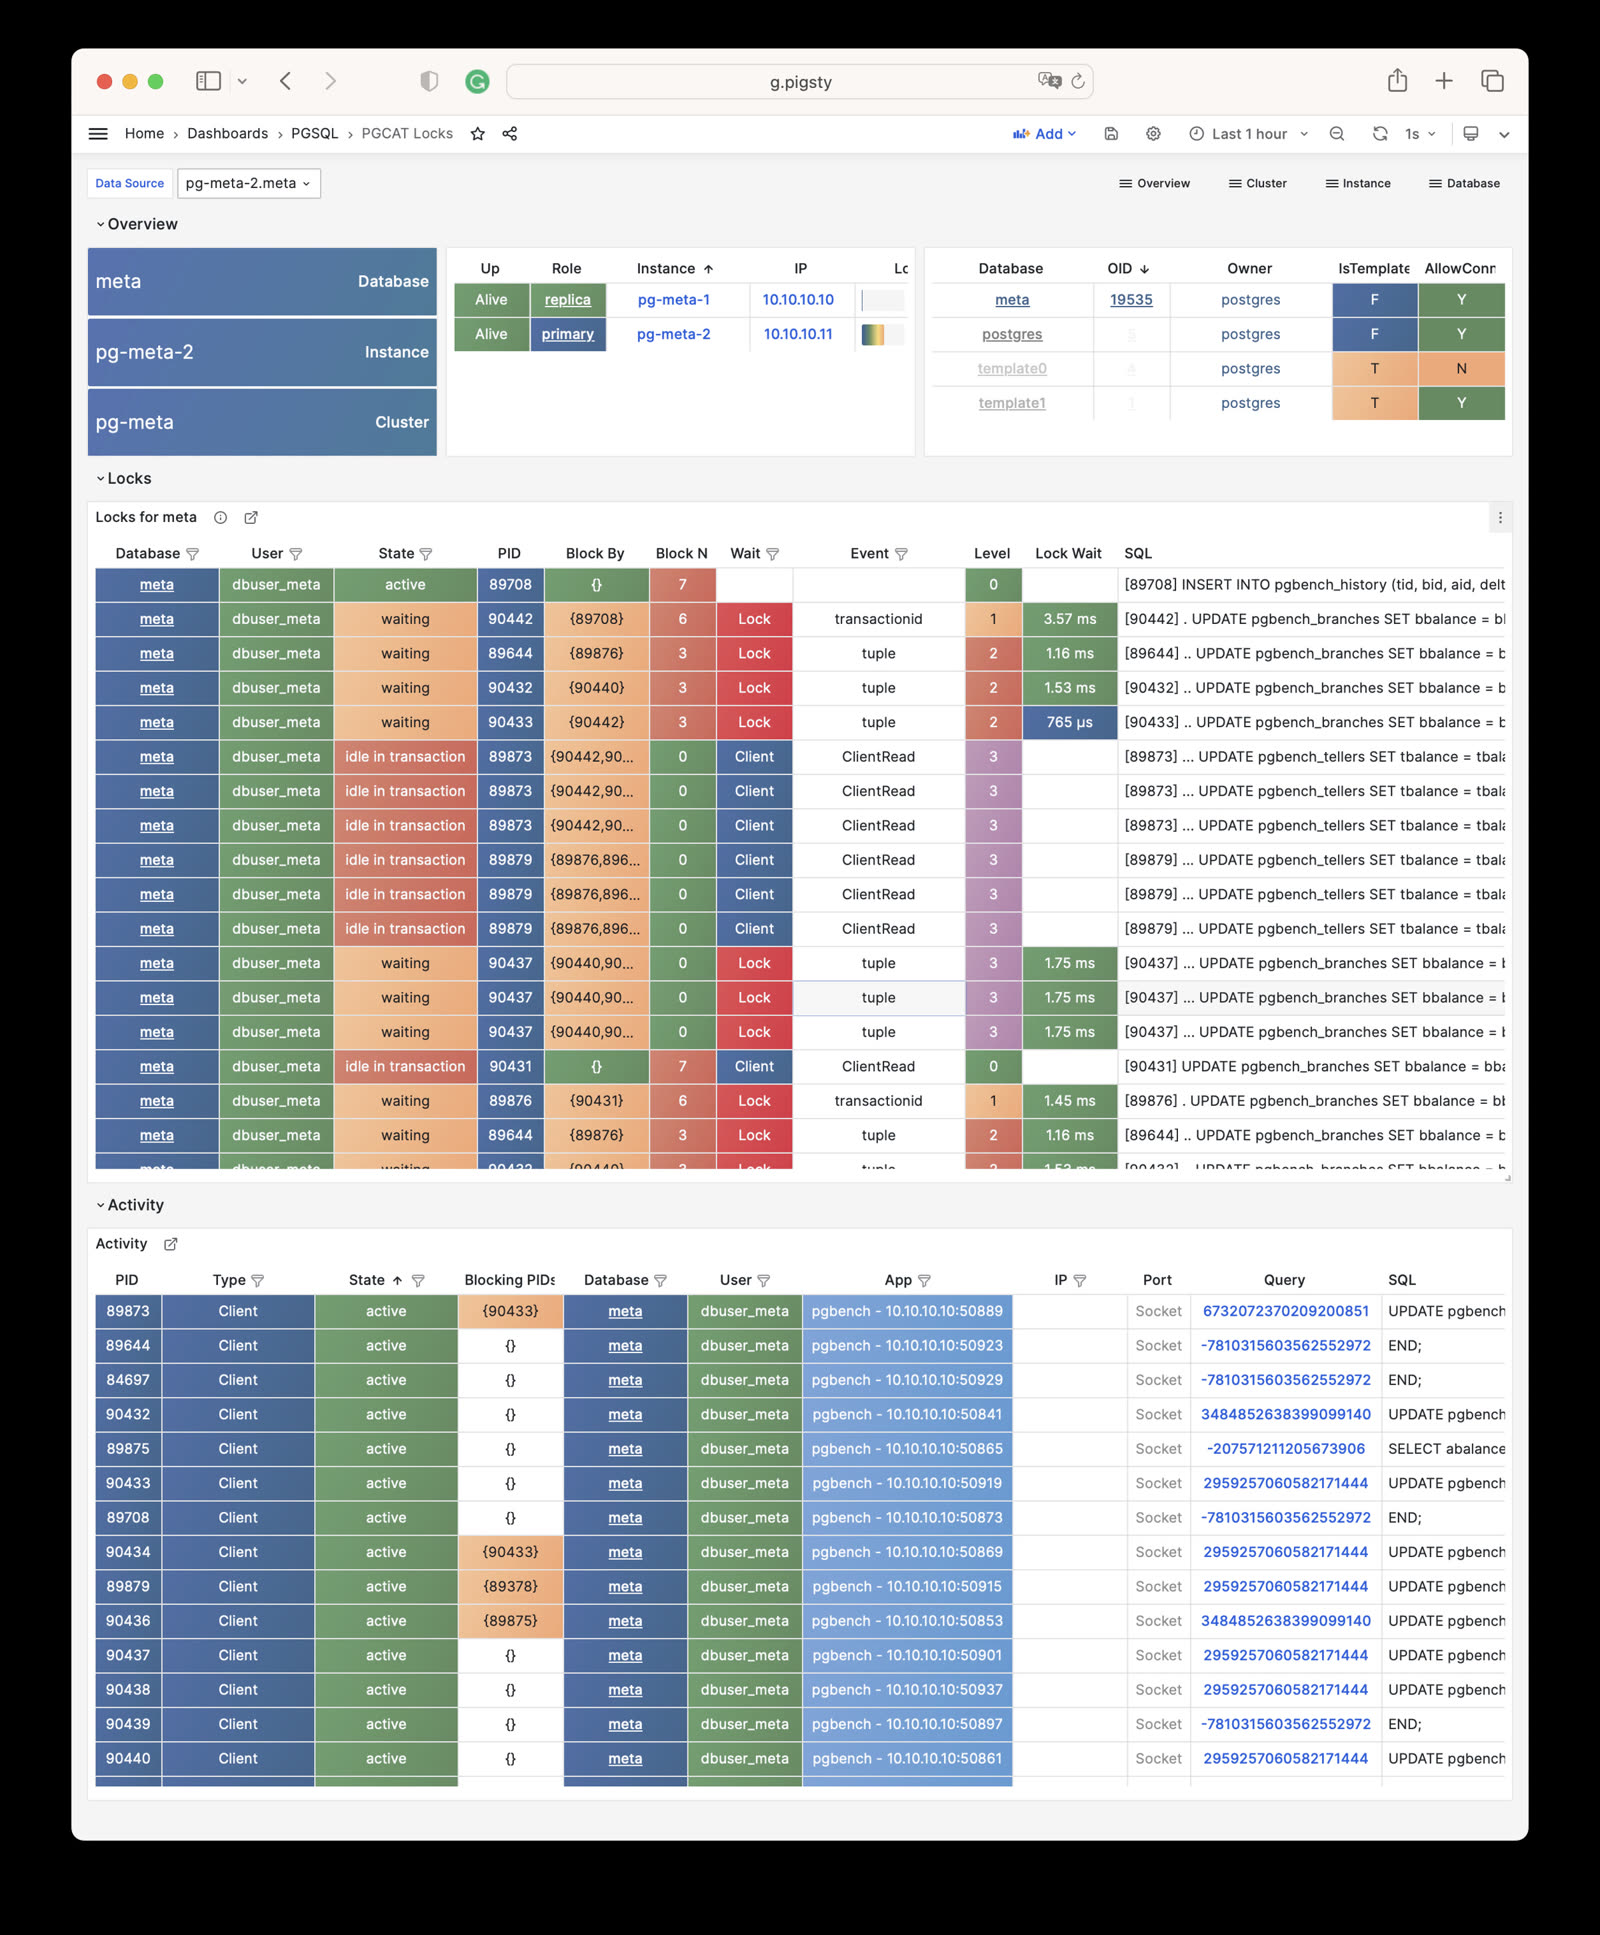
In this mode, the monitoring system will not have metrics from hosts, connection pools, load balancers, or high availability components, but the database itself and real-time status information from the data catalog are still available. Pigsty provides two dedicated monitoring dashboards focused on PostgreSQL metrics: PGRDS Cluster and PGRDS Instance, while overview and database-level monitoring reuses existing dashboards. Since Pigsty cannot manage your RDS, users need to configure monitoring objects on the target database in advance.

Here we use the sandbox environment as an example: suppose the pg-meta cluster is an RDS instance pg-foo-1 to be monitored, and the pg-test cluster is an RDS cluster pg-bar to be monitored:

  1. Create monitoring schemas, users, and permissions on the target. Refer to Monitor Setup for details

  2. Declare the cluster in the configuration inventory. For example, if we want to monitor “remote” pg-meta & pg-test clusters:

    infra:            # Infra cluster for proxies, monitoring, alerts, etc.
      hosts: { 10.10.10.10: { infra_seq: 1 } }
      vars:           # Install pg_exporter on group 'infra' for remote postgres RDS
        pg_exporters: # List all remote instances here, assign a unique unused local port for k
          20001: { pg_cluster: pg-foo, pg_seq: 1, pg_host: 10.10.10.10 , pg_databases: [{ name: meta }] } # Register meta database as Grafana datasource
    
          20002: { pg_cluster: pg-bar, pg_seq: 1, pg_host: 10.10.10.11 , pg_port: 5432 } # Different connection string methods
          20003: { pg_cluster: pg-bar, pg_seq: 2, pg_host: 10.10.10.12 , pg_exporter_url: 'postgres://dbuser_monitor:[email protected]:5432/postgres?sslmode=disable'}
          20004: { pg_cluster: pg-bar, pg_seq: 3, pg_host: 10.10.10.13 , pg_monitor_username: dbuser_monitor, pg_monitor_password: DBUser.Monitor }
    

    Databases listed in the pg_databases field will be registered in Grafana as PostgreSQL datasources, providing data support for PGCAT monitoring dashboards. If you don’t want to use PGCAT and register databases in Grafana, simply set pg_databases to an empty array or leave it blank.

    pigsty-monitor.jpg

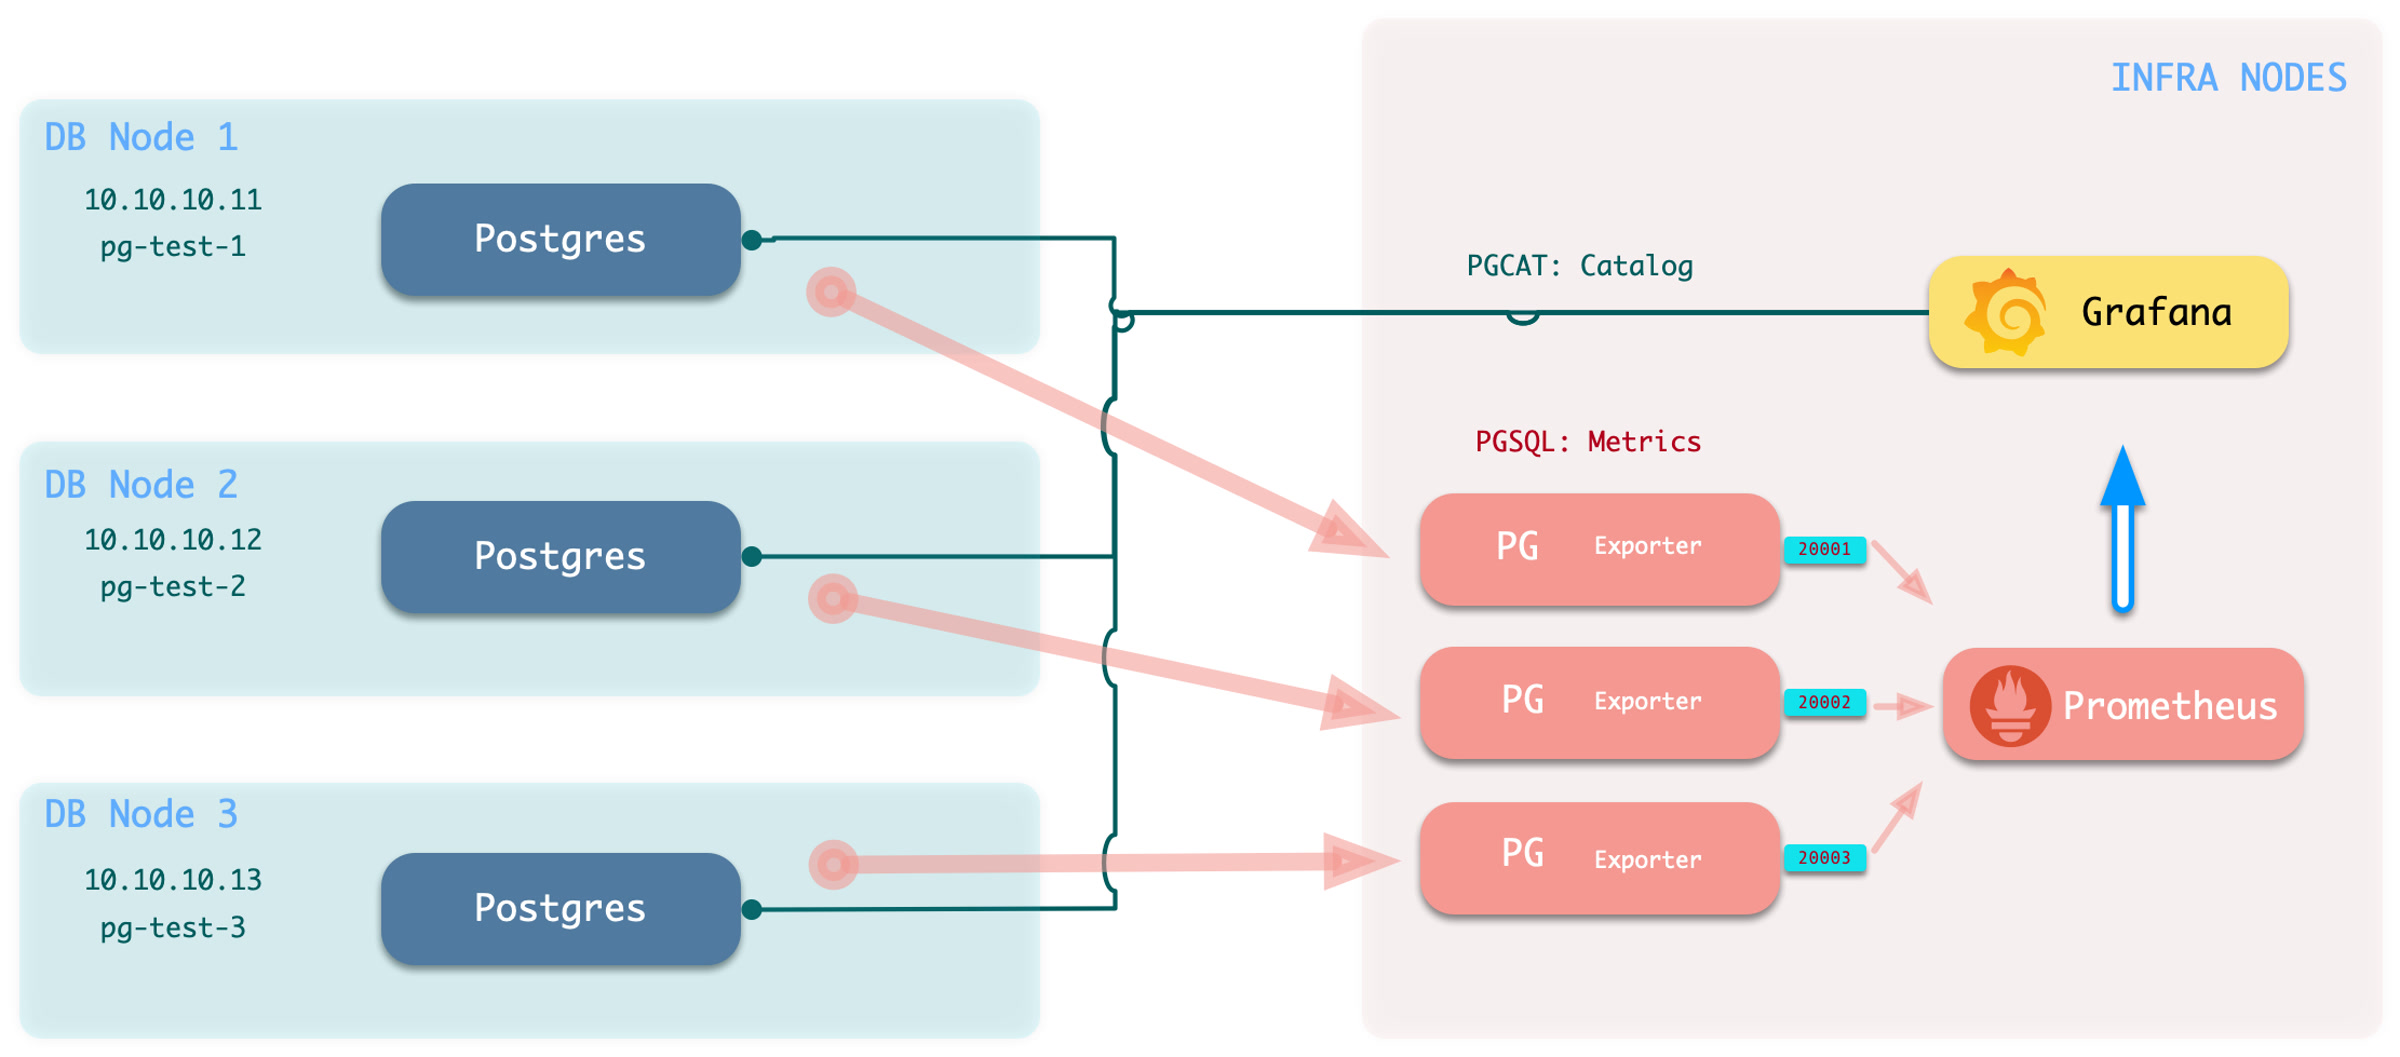
  3. Execute the add monitoring command: bin/pgmon-add <clsname>

    bin/pgmon-add pg-foo  # Bring pg-foo cluster into monitoring
    bin/pgmon-add pg-bar  # Bring pg-bar cluster into monitoring
    
  4. To remove remote cluster monitoring targets, use bin/pgmon-rm <clsname>

    bin/pgmon-rm pg-foo  # Remove pg-foo from Pigsty monitoring
    bin/pgmon-rm pg-bar  # Remove pg-bar from Pigsty monitoring
    

You can use more parameters to override default pg_exporter options. Here’s an example configuration for monitoring Aliyun RDS for PostgreSQL and PolarDB with Pigsty:

Example: Monitoring Aliyun RDS for PostgreSQL and PolarDB

For details, refer to: remote.yml

infra:            # Infra cluster for proxies, monitoring, alerts, etc.
  hosts: { 10.10.10.10: { infra_seq: 1 } }
  vars:
    pg_exporters:   # List all remote RDS PG instances to be monitored here

      20001:        # Assign a unique unused local port for local monitoring agent, this is a PolarDB primary
        pg_cluster: pg-polar                  # RDS cluster name (identity parameter, manually assigned name in monitoring system)
        pg_seq: 1                             # RDS instance number (identity parameter, manually assigned name in monitoring system)
        pg_host: pc-2ze379wb1d4irc18x.polardbpg.rds.aliyuncs.com # RDS host address
        pg_port: 1921                         # RDS port (from console connection info)
        pg_exporter_auto_discovery: true      # Disable new database auto-discovery feature
        pg_exporter_include_database: 'test'  # Only monitor databases in this list (comma-separated)
        pg_monitor_username: dbuser_monitor   # Monitoring username, overrides global config
        pg_monitor_password: DBUser_Monitor   # Monitoring password, overrides global config
        pg_databases: [{ name: test }]        # List of databases to enable PGCAT for, only name field needed, set register_datasource to false to not register

      20002:       # This is a PolarDB standby
        pg_cluster: pg-polar                  # RDS cluster name (identity parameter, manually assigned name in monitoring system)
        pg_seq: 2                             # RDS instance number (identity parameter, manually assigned name in monitoring system)
        pg_host: pe-2ze7tg620e317ufj4.polarpgmxs.rds.aliyuncs.com # RDS host address
        pg_port: 1521                         # RDS port (from console connection info)
        pg_exporter_auto_discovery: true      # Disable new database auto-discovery feature
        pg_exporter_include_database: 'test,postgres'  # Only monitor databases in this list (comma-separated)
        pg_monitor_username: dbuser_monitor   # Monitoring username
        pg_monitor_password: DBUser_Monitor   # Monitoring password
        pg_databases: [ { name: test } ]        # List of databases to enable PGCAT for, only name field needed, set register_datasource to false to not register

      20004: # This is a basic single-node RDS for PostgreSQL instance
        pg_cluster: pg-rds                    # RDS cluster name (identity parameter, manually assigned name in monitoring system)
        pg_seq: 1                             # RDS instance number (identity parameter, manually assigned name in monitoring system)
        pg_host: pgm-2zern3d323fe9ewk.pg.rds.aliyuncs.com  # RDS host address
        pg_port: 5432                         # RDS port (from console connection info)
        pg_exporter_auto_discovery: true      # Disable new database auto-discovery feature
        pg_exporter_include_database: 'rds'   # Only monitor databases in this list (comma-separated)
        pg_monitor_username: dbuser_monitor   # Monitoring username
        pg_monitor_password: DBUser_Monitor   # Monitoring password
        pg_databases: [ { name: rds } ]       # List of databases to enable PGCAT for, only name field needed, set register_datasource to false to not register

      20005: # This is a high-availability RDS for PostgreSQL cluster primary
        pg_cluster: pg-rdsha                  # RDS cluster name (identity parameter, manually assigned name in monitoring system)
        pg_seq: 1                             # RDS instance number (identity parameter, manually assigned name in monitoring system)
        pg_host: pgm-2ze3d35d27bq08wu.pg.rds.aliyuncs.com  # RDS host address
        pg_port: 5432                         # RDS port (from console connection info)
        pg_exporter_include_database: 'rds'   # Only monitor databases in this list (comma-separated)
        pg_databases: [ { name: rds }, {name : test} ]  # Include these two databases in PGCAT management, register as Grafana datasources

      20006: # This is a high-availability RDS for PostgreSQL cluster read-only instance (standby)
        pg_cluster: pg-rdsha                  # RDS cluster name (identity parameter, manually assigned name in monitoring system)
        pg_seq: 2                             # RDS instance number (identity parameter, manually assigned name in monitoring system)
        pg_host: pgr-2zexqxalk7d37edt.pg.rds.aliyuncs.com  # RDS host address
        pg_port: 5432                         # RDS port (from console connection info)
        pg_exporter_include_database: 'rds'   # Only monitor databases in this list (comma-separated)
        pg_databases: [ { name: rds }, {name : test} ]  # Include these two databases in PGCAT management, register as Grafana datasources

Monitor Setup

When you want to monitor existing instances, whether RDS or self-built PostgreSQL instances, you need to configure the target database so that Pigsty can access them.

To monitor an external existing PostgreSQL instance, you need a connection string that can access that instance/cluster. Any accessible connection string (business user, superuser) can be used, but we recommend using a dedicated monitoring user to avoid permission leaks.

  • Monitor User: The default username is dbuser_monitor, which should belong to the pg_monitor role group or have access to relevant views
  • Monitor Authentication: Default password authentication is used; ensure HBA policies allow the monitoring user to access databases from the admin node or DB node locally
  • Monitor Schema: Fixed schema name monitor is used for installing additional monitoring views and extension plugins; optional but recommended
  • Monitor Extension: Strongly recommended to enable the built-in monitoring extension pg_stat_statements
  • Monitor Views: Monitoring views are optional but can provide additional metric support

Monitor User

Using the default monitoring user dbuser_monitor as an example, create the following user on the target database cluster.

CREATE USER dbuser_monitor;                                       -- Create monitoring user
COMMENT ON ROLE dbuser_monitor IS 'system monitor user';          -- Comment on monitoring user
GRANT pg_monitor TO dbuser_monitor;                               -- Grant pg_monitor privilege to monitoring user, otherwise some metrics cannot be collected

ALTER USER dbuser_monitor PASSWORD 'DBUser.Monitor';              -- Modify monitoring user password as needed (strongly recommended! but keep consistent with Pigsty config)
ALTER USER dbuser_monitor SET log_min_duration_statement = 1000;  -- Recommended to avoid logs filling up with monitoring slow queries
ALTER USER dbuser_monitor SET search_path = monitor,public;       -- Recommended to ensure pg_stat_statements extension works properly

Please note that the monitoring user and password created here should be consistent with pg_monitor_username and pg_monitor_password.


Monitor Authentication

Configure the database pg_hba.conf file, adding the following rules to allow the monitoring user to access all databases from localhost and the admin machine using password authentication.

# allow local role monitor with password
local   all  dbuser_monitor                    md5
host    all  dbuser_monitor  127.0.0.1/32      md5
host    all  dbuser_monitor  <admin_machine_IP>/32 md5

If your RDS doesn’t support defining HBA, simply whitelist the internal IP address of the machine running Pigsty.


Monitor Schema

The monitoring schema is optional; even without it, the main functionality of Pigsty’s monitoring system can work properly, but we strongly recommend creating this schema.

CREATE SCHEMA IF NOT EXISTS monitor;               -- Create dedicated monitoring schema
GRANT USAGE ON SCHEMA monitor TO dbuser_monitor;   -- Allow monitoring user to use it

Monitor Extension

The monitoring extension is optional, but we strongly recommend enabling the pg_stat_statements extension, which provides important data about query performance.

Note: This extension must be listed in the database parameter shared_preload_libraries to take effect, and modifying that parameter requires a database restart.

CREATE EXTENSION IF NOT EXISTS "pg_stat_statements" WITH SCHEMA "monitor";

Please note that you should install this extension in the default admin database postgres. Sometimes RDS doesn’t allow you to create a monitoring schema in the postgres database. In such cases, you can install the pg_stat_statements plugin in the default public schema, as long as you ensure the monitoring user’s search_path is configured as above so it can find the pg_stat_statements view.

CREATE EXTENSION IF NOT EXISTS "pg_stat_statements";
ALTER USER dbuser_monitor SET search_path = monitor,public; -- Recommended to ensure pg_stat_statements extension works properly

Monitor Views

Monitoring views provide several commonly used pre-processed results and encapsulate permissions for monitoring metrics that require high privileges (such as shared memory allocation), making them convenient for querying and use. Strongly recommended to create in all databases requiring monitoring.

Monitoring schema and monitoring view definitions
----------------------------------------------------------------------
-- Table bloat estimate : monitor.pg_table_bloat
----------------------------------------------------------------------
DROP VIEW IF EXISTS monitor.pg_table_bloat CASCADE;
CREATE OR REPLACE VIEW monitor.pg_table_bloat AS
SELECT CURRENT_CATALOG AS datname, nspname, relname , tblid , bs * tblpages AS size,
       CASE WHEN tblpages - est_tblpages_ff > 0 THEN (tblpages - est_tblpages_ff)/tblpages::FLOAT ELSE 0 END AS ratio
FROM (
         SELECT ceil( reltuples / ( (bs-page_hdr)*fillfactor/(tpl_size*100) ) ) + ceil( toasttuples / 4 ) AS est_tblpages_ff,
                tblpages, fillfactor, bs, tblid, nspname, relname, is_na
         FROM (
                  SELECT
                      ( 4 + tpl_hdr_size + tpl_data_size + (2 * ma)
                          - CASE WHEN tpl_hdr_size % ma = 0 THEN ma ELSE tpl_hdr_size % ma END
                          - CASE WHEN ceil(tpl_data_size)::INT % ma = 0 THEN ma ELSE ceil(tpl_data_size)::INT % ma END
                          ) AS tpl_size, (heappages + toastpages) AS tblpages, heappages,
                      toastpages, reltuples, toasttuples, bs, page_hdr, tblid, nspname, relname, fillfactor, is_na
                  FROM (
                           SELECT
                               tbl.oid AS tblid, ns.nspname , tbl.relname, tbl.reltuples,
                               tbl.relpages AS heappages, coalesce(toast.relpages, 0) AS toastpages,
                               coalesce(toast.reltuples, 0) AS toasttuples,
                               coalesce(substring(array_to_string(tbl.reloptions, ' ') FROM 'fillfactor=([0-9]+)')::smallint, 100) AS fillfactor,
                               current_setting('block_size')::numeric AS bs,
                               CASE WHEN version()~'mingw32' OR version()~'64-bit|x86_64|ppc64|ia64|amd64' THEN 8 ELSE 4 END AS ma,
                               24 AS page_hdr,
                               23 + CASE WHEN MAX(coalesce(s.null_frac,0)) > 0 THEN ( 7 + count(s.attname) ) / 8 ELSE 0::int END
                                   + CASE WHEN bool_or(att.attname = 'oid' and att.attnum < 0) THEN 4 ELSE 0 END AS tpl_hdr_size,
                               sum( (1-coalesce(s.null_frac, 0)) * coalesce(s.avg_width, 0) ) AS tpl_data_size,
                               bool_or(att.atttypid = 'pg_catalog.name'::regtype)
                                   OR sum(CASE WHEN att.attnum > 0 THEN 1 ELSE 0 END) <> count(s.attname) AS is_na
                           FROM pg_attribute AS att
                                    JOIN pg_class AS tbl ON att.attrelid = tbl.oid
                                    JOIN pg_namespace AS ns ON ns.oid = tbl.relnamespace
                                    LEFT JOIN pg_stats AS s ON s.schemaname=ns.nspname AND s.tablename = tbl.relname AND s.inherited=false AND s.attname=att.attname
                                    LEFT JOIN pg_class AS toast ON tbl.reltoastrelid = toast.oid
                           WHERE NOT att.attisdropped AND tbl.relkind = 'r' AND nspname NOT IN ('pg_catalog','information_schema')
                           GROUP BY 1,2,3,4,5,6,7,8,9,10
                       ) AS s
              ) AS s2
     ) AS s3
WHERE NOT is_na;
COMMENT ON VIEW monitor.pg_table_bloat IS 'postgres table bloat estimate';

GRANT SELECT ON monitor.pg_table_bloat TO pg_monitor;

----------------------------------------------------------------------
-- Index bloat estimate : monitor.pg_index_bloat
----------------------------------------------------------------------
DROP VIEW IF EXISTS monitor.pg_index_bloat CASCADE;
CREATE OR REPLACE VIEW monitor.pg_index_bloat AS
SELECT CURRENT_CATALOG AS datname, nspname, idxname AS relname, tblid, idxid, relpages::BIGINT * bs AS size,
       COALESCE((relpages - ( reltuples * (6 + ma - (CASE WHEN index_tuple_hdr % ma = 0 THEN ma ELSE index_tuple_hdr % ma END)
                                               + nulldatawidth + ma - (CASE WHEN nulldatawidth % ma = 0 THEN ma ELSE nulldatawidth % ma END))
                                  / (bs - pagehdr)::FLOAT  + 1 )), 0) / relpages::FLOAT AS ratio
FROM (
         SELECT nspname,idxname,indrelid AS tblid,indexrelid AS idxid,
                reltuples,relpages,
                current_setting('block_size')::INTEGER                                                               AS bs,
                (CASE WHEN version() ~ 'mingw32' OR version() ~ '64-bit|x86_64|ppc64|ia64|amd64' THEN 8 ELSE 4 END)  AS ma,
                24                                                                                                   AS pagehdr,
                (CASE WHEN max(COALESCE(pg_stats.null_frac, 0)) = 0 THEN 2 ELSE 6 END)                               AS index_tuple_hdr,
                sum((1.0 - COALESCE(pg_stats.null_frac, 0.0)) *
                    COALESCE(pg_stats.avg_width, 1024))::INTEGER                                                     AS nulldatawidth
         FROM pg_attribute
                  JOIN (
             SELECT pg_namespace.nspname,
                    ic.relname                                                   AS idxname,
                    ic.reltuples,
                    ic.relpages,
                    pg_index.indrelid,
                    pg_index.indexrelid,
                    tc.relname                                                   AS tablename,
                    regexp_split_to_table(pg_index.indkey::TEXT, ' ') :: INTEGER AS attnum,
                    pg_index.indexrelid                                          AS index_oid
             FROM pg_index
                      JOIN pg_class ic ON pg_index.indexrelid = ic.oid
                      JOIN pg_class tc ON pg_index.indrelid = tc.oid
                      JOIN pg_namespace ON pg_namespace.oid = ic.relnamespace
                      JOIN pg_am ON ic.relam = pg_am.oid
             WHERE pg_am.amname = 'btree' AND ic.relpages > 0 AND nspname NOT IN ('pg_catalog', 'information_schema')
         ) ind_atts ON pg_attribute.attrelid = ind_atts.indexrelid AND pg_attribute.attnum = ind_atts.attnum
                  JOIN pg_stats ON pg_stats.schemaname = ind_atts.nspname
             AND ((pg_stats.tablename = ind_atts.tablename AND pg_stats.attname = pg_get_indexdef(pg_attribute.attrelid, pg_attribute.attnum, TRUE))
                 OR (pg_stats.tablename = ind_atts.idxname AND pg_stats.attname = pg_attribute.attname))
         WHERE pg_attribute.attnum > 0
         GROUP BY 1, 2, 3, 4, 5, 6
     ) est;
COMMENT ON VIEW monitor.pg_index_bloat IS 'postgres index bloat estimate (btree-only)';

GRANT SELECT ON monitor.pg_index_bloat TO pg_monitor;

----------------------------------------------------------------------
-- Relation Bloat : monitor.pg_bloat
----------------------------------------------------------------------
DROP VIEW IF EXISTS monitor.pg_bloat CASCADE;
CREATE OR REPLACE VIEW monitor.pg_bloat AS
SELECT coalesce(ib.datname, tb.datname)                                                   AS datname,
       coalesce(ib.nspname, tb.nspname)                                                   AS nspname,
       coalesce(ib.tblid, tb.tblid)                                                       AS tblid,
       coalesce(tb.nspname || '.' || tb.relname, ib.nspname || '.' || ib.tblid::RegClass) AS tblname,
       tb.size                                                                            AS tbl_size,
       CASE WHEN tb.ratio < 0 THEN 0 ELSE round(tb.ratio::NUMERIC, 6) END                 AS tbl_ratio,
       (tb.size * (CASE WHEN tb.ratio < 0 THEN 0 ELSE tb.ratio::NUMERIC END)) ::BIGINT    AS tbl_wasted,
       ib.idxid,
       ib.nspname || '.' || ib.relname                                                    AS idxname,
       ib.size                                                                            AS idx_size,
       CASE WHEN ib.ratio < 0 THEN 0 ELSE round(ib.ratio::NUMERIC, 5) END                 AS idx_ratio,
       (ib.size * (CASE WHEN ib.ratio < 0 THEN 0 ELSE ib.ratio::NUMERIC END)) ::BIGINT    AS idx_wasted
FROM monitor.pg_index_bloat ib
         FULL OUTER JOIN monitor.pg_table_bloat tb ON ib.tblid = tb.tblid;

COMMENT ON VIEW monitor.pg_bloat IS 'postgres relation bloat detail';
GRANT SELECT ON monitor.pg_bloat TO pg_monitor;

----------------------------------------------------------------------
-- monitor.pg_index_bloat_human
----------------------------------------------------------------------
DROP VIEW IF EXISTS monitor.pg_index_bloat_human CASCADE;
CREATE OR REPLACE VIEW monitor.pg_index_bloat_human AS
SELECT idxname                            AS name,
       tblname,
       idx_wasted                         AS wasted,
       pg_size_pretty(idx_size)           AS idx_size,
       round(100 * idx_ratio::NUMERIC, 2) AS idx_ratio,
       pg_size_pretty(idx_wasted)         AS idx_wasted,
       pg_size_pretty(tbl_size)           AS tbl_size,
       round(100 * tbl_ratio::NUMERIC, 2) AS tbl_ratio,
       pg_size_pretty(tbl_wasted)         AS tbl_wasted
FROM monitor.pg_bloat
WHERE idxname IS NOT NULL;
COMMENT ON VIEW monitor.pg_index_bloat_human IS 'postgres index bloat info in human-readable format';
GRANT SELECT ON monitor.pg_index_bloat_human TO pg_monitor;


----------------------------------------------------------------------
-- monitor.pg_table_bloat_human
----------------------------------------------------------------------
DROP VIEW IF EXISTS monitor.pg_table_bloat_human CASCADE;
CREATE OR REPLACE VIEW monitor.pg_table_bloat_human AS
SELECT tblname                                          AS name,
       idx_wasted + tbl_wasted                          AS wasted,
       pg_size_pretty(idx_wasted + tbl_wasted)          AS all_wasted,
       pg_size_pretty(tbl_wasted)                       AS tbl_wasted,
       pg_size_pretty(tbl_size)                         AS tbl_size,
       tbl_ratio,
       pg_size_pretty(idx_wasted)                       AS idx_wasted,
       pg_size_pretty(idx_size)                         AS idx_size,
       round(idx_wasted::NUMERIC * 100.0 / idx_size, 2) AS idx_ratio
FROM (SELECT datname,
             nspname,
             tblname,
             coalesce(max(tbl_wasted), 0)                         AS tbl_wasted,
             coalesce(max(tbl_size), 1)                           AS tbl_size,
             round(100 * coalesce(max(tbl_ratio), 0)::NUMERIC, 2) AS tbl_ratio,
             coalesce(sum(idx_wasted), 0)                         AS idx_wasted,
             coalesce(sum(idx_size), 1)                           AS idx_size
      FROM monitor.pg_bloat
      WHERE tblname IS NOT NULL
      GROUP BY 1, 2, 3
     ) d;
COMMENT ON VIEW monitor.pg_table_bloat_human IS 'postgres table bloat info in human-readable format';
GRANT SELECT ON monitor.pg_table_bloat_human TO pg_monitor;


----------------------------------------------------------------------
-- Activity Overview: monitor.pg_session
----------------------------------------------------------------------
DROP VIEW IF EXISTS monitor.pg_session CASCADE;
CREATE OR REPLACE VIEW monitor.pg_session AS
SELECT coalesce(datname, 'all') AS datname, numbackends, active, idle, ixact, max_duration, max_tx_duration, max_conn_duration
FROM (
         SELECT datname,
                count(*)                                         AS numbackends,
                count(*) FILTER ( WHERE state = 'active' )       AS active,
                count(*) FILTER ( WHERE state = 'idle' )         AS idle,
                count(*) FILTER ( WHERE state = 'idle in transaction'
                    OR state = 'idle in transaction (aborted)' ) AS ixact,
                max(extract(epoch from now() - state_change))
                FILTER ( WHERE state = 'active' )                AS max_duration,
                max(extract(epoch from now() - xact_start))      AS max_tx_duration,
                max(extract(epoch from now() - backend_start))   AS max_conn_duration
         FROM pg_stat_activity
         WHERE backend_type = 'client backend'
           AND pid <> pg_backend_pid()
         GROUP BY ROLLUP (1)
         ORDER BY 1 NULLS FIRST
     ) t;
COMMENT ON VIEW monitor.pg_session IS 'postgres activity group by session';
GRANT SELECT ON monitor.pg_session TO pg_monitor;


----------------------------------------------------------------------
-- Sequential Scan: monitor.pg_seq_scan
----------------------------------------------------------------------
DROP VIEW IF EXISTS monitor.pg_seq_scan CASCADE;
CREATE OR REPLACE VIEW monitor.pg_seq_scan AS
SELECT schemaname                                                        AS nspname,
       relname,
       seq_scan,
       seq_tup_read,
       seq_tup_read / seq_scan                                           AS seq_tup_avg,
       idx_scan,
       n_live_tup + n_dead_tup                                           AS tuples,
       round(n_live_tup * 100.0::NUMERIC / (n_live_tup + n_dead_tup), 2) AS live_ratio
FROM pg_stat_user_tables
WHERE seq_scan > 0
  and (n_live_tup + n_dead_tup) > 0
ORDER BY seq_scan DESC;
COMMENT ON VIEW monitor.pg_seq_scan IS 'table that have seq scan';
GRANT SELECT ON monitor.pg_seq_scan TO pg_monitor;
Function for viewing shared memory allocation (PG13 and above)
DROP FUNCTION IF EXISTS monitor.pg_shmem() CASCADE;
CREATE OR REPLACE FUNCTION monitor.pg_shmem() RETURNS SETOF
    pg_shmem_allocations AS $$ SELECT * FROM pg_shmem_allocations;$$ LANGUAGE SQL SECURITY DEFINER;
COMMENT ON FUNCTION monitor.pg_shmem() IS 'security wrapper for system view pg_shmem';
REVOKE ALL ON FUNCTION monitor.pg_shmem() FROM PUBLIC;
GRANT EXECUTE ON FUNCTION monitor.pg_shmem() TO pg_monitor;

1 - Dashboards

Pigsty provides many out-of-the-box Grafana monitoring dashboards for PostgreSQL

Pigsty provides many out-of-the-box Grafana monitoring dashboards for PostgreSQL: Demo & Gallery.

There are 26 PostgreSQL-related monitoring dashboards in Pigsty, organized hierarchically into Overview, Cluster, Instance, and Database categories, and by data source into PGSQL, PGCAT, and PGLOG categories.

pigsty-dashboard.jpg


Overview

OverviewClusterInstanceDatabase
PGSQL OverviewPGSQL ClusterPGSQL InstancePGSQL Database
PGSQL AlertPGRDS ClusterPGRDS InstancePGCAT Database
PGSQL ShardPGSQL ActivityPGCAT InstancePGSQL Tables
PGSQL ReplicationPGSQL PersistPGSQL Table
PGSQL ServicePGSQL ProxyPGCAT Table
PGSQL DatabasesPGSQL PgbouncerPGSQL Query
PGSQL PatroniPGSQL SessionPGCAT Query
PGSQL PITRPGSQL XactsPGCAT Locks
PGSQL ExporterPGCAT Schema

Overview

  • pgsql-overview: Main dashboard for the PGSQL module
  • pgsql-alert: Global critical metrics and alert events for PGSQL
  • pgsql-shard: Overview of horizontally sharded PGSQL clusters, such as Citus / GPSQL clusters

Cluster

  • pgsql-cluster: Main dashboard for a PGSQL cluster
  • pgrds-cluster: RDS version of PGSQL Cluster, focused on all PostgreSQL-specific metrics
  • pgsql-activity: Focus on PGSQL cluster sessions/load/QPS/TPS/locks
  • pgsql-replication: Focus on PGSQL cluster replication, slots, and pub/sub
  • pgsql-service: Focus on PGSQL cluster services, proxies, routing, and load balancing
  • pgsql-databases: Focus on database CRUD, slow queries, and table statistics across all instances
  • pgsql-patroni: Focus on cluster high availability status and Patroni component status
  • pgsql-pitr: Focus on cluster PITR process context for point-in-time recovery assistance

Instance

  • pgsql-instance: Main dashboard for a single PGSQL instance
  • pgrds-instance: RDS version of PGSQL Instance, focused on all PostgreSQL-specific metrics
  • pgcat-instance: Instance information retrieved directly from the database catalog
  • pgsql-proxy: Detailed metrics for a single HAProxy load balancer
  • pgsql-pgbouncer: Metrics overview in a single Pgbouncer connection pool instance
  • pgsql-persist: Persistence metrics: WAL, XID, checkpoints, archiving, IO
  • pgsql-session: Session and active/idle time metrics in a single instance
  • pgsql-xacts: Metrics related to transactions, locks, TPS/QPS
  • pgsql-exporter: Self-monitoring metrics for Postgres and Pgbouncer monitoring components

Database

  • pgsql-database: Main dashboard for a single PGSQL database
  • pgcat-database: Database information retrieved directly from the database catalog
  • pgsql-tables: Table/index access metrics within a single database
  • pgsql-table: Details of a single table (QPS/RT/index/sequences…)
  • pgcat-table: Details of a single table retrieved directly from the database catalog (stats/bloat…)
  • pgsql-query: Details of a single query (QPS/RT)
  • pgcat-query: Details of a single query retrieved directly from the database catalog (SQL/stats)
  • pgcat-schema: Information about schemas retrieved directly from the database catalog (tables/indexes/sequences…)
  • pgcat-locks: Information about activities and lock waits retrieved directly from the database catalog

Overview

PGSQL Overview: Main dashboard for the PGSQL module

PGSQL Overview

pgsql-overview.jpg

PGSQL Alert: Global critical metrics overview and alert event listing for PGSQL

PGSQL Alert

pgsql-alert.jpg

PGSQL Shard: Shows horizontal metric comparisons within a PGSQL horizontally sharded cluster, such as CITUS / GPSQL clusters

PGSQL Shard

pgsql-shard.jpg


Cluster

PGSQL Cluster: Main dashboard for a PGSQL cluster

PGSQL Cluster

pgsql-cluster.jpg

PGRDS Cluster: RDS version of PGSQL Cluster, focused on all PostgreSQL-specific metrics

PGRDS Cluster

pgrds-cluster.jpg

PGSQL Service: Focus on PGSQL cluster services, proxies, routing, and load balancing

PGSQL Service

pgsql-service.jpg

PGSQL Activity: Focus on PGSQL cluster sessions/load/QPS/TPS/locks

PGSQL Activity

pgsql-activity.jpg

PGSQL Replication: Focus on PGSQL cluster replication, slots, and pub/sub

PGSQL Replication

pgsql-replication.jpg

PGSQL Databases: Focus on database CRUD, slow queries, and table statistics across all instances

PGSQL Databases

pgsql-databases.jpg

PGSQL Patroni: Focus on cluster high availability status and Patroni component status

PGSQL Patroni

pgsql-patroni.jpg

PGSQL PITR: Focus on cluster PITR process context for point-in-time recovery assistance

PGSQL PITR

pgsql-patroni.jpg


Instance

PGSQL Instance: Main dashboard for a single PGSQL instance

PGSQL Instance

pgsql-instance.jpg

PGRDS Instance: RDS version of PGSQL Instance, focused on all PostgreSQL-specific metrics

PGRDS Instance

pgrds-instance.jpg

PGSQL Proxy: Detailed metrics for a single HAProxy load balancer

PGSQL Proxy

pgsql-proxy.jpg

PGSQL Pgbouncer: Metrics overview in a single Pgbouncer connection pool instance

PGSQL Pgbouncer

pgsql-pgbouncer.jpg

PGSQL Persist: Persistence metrics: WAL, XID, checkpoints, archiving, IO

PGSQL Persist

pgsql-persist.jpg

PGSQL Xacts: Metrics related to transactions, locks, TPS/QPS

PGSQL Xacts

pgsql-xacts.jpg

PGSQL Session: Session and active/idle time metrics in a single instance

PGSQL Session

pgsql-session.jpg

PGSQL Exporter: Self-monitoring metrics for Postgres/Pgbouncer monitoring components

PGSQL Exporter

pgsql-exporter.jpg


Database

PGSQL Database: Main dashboard for a single PGSQL database

PGSQL Database

pgsql-database.jpg

PGSQL Tables: Table/index access metrics within a single database

PGSQL Tables

pgsql-tables.jpg

PGSQL Table: Details of a single table (QPS/RT/index/sequences…)

PGSQL Table

pgsql-table.jpg

PGSQL Query: Details of a single query (QPS/RT)

PGSQL Query

pgsql-query.jpg


PGCAT

PGCAT Instance: Instance information retrieved directly from the database catalog

PGCAT Instance

pgcat-instance.jpg

PGCAT Database: Database information retrieved directly from the database catalog

PGCAT Database

pgcat-database.jpg

PGCAT Schema: Information about schemas retrieved directly from the database catalog (tables/indexes/sequences…)

PGCAT Schema

pgcat-schema.jpg

PGCAT Table: Details of a single table retrieved directly from the database catalog (stats/bloat…)

PGCAT Table

pgcat-table.jpg

PGCAT Query: Details of a single query retrieved directly from the database catalog (SQL/stats)

PGCAT Query

pgcat-query.jpg

PGCAT Locks: Information about activities and lock waits retrieved directly from the database catalog

PGCAT Locks

pgcat-locks.jpg


PGLOG

PGLOG Overview: Overview of CSV log samples in Pigsty CMDB

PGLOG Overview

pglog-overview.jpg

PGLOG Session: Log details of a session in CSV log samples in Pigsty CMDB

PGLOG Session

pglog-session.jpg


For details, refer to pigsty/wiki/gallery.

PGSQL Overview

pgsql-overview.jpg

PGSQL Shard

pgsql-shard.jpg

PGSQL Cluster

pgsql-cluster.jpg

PGSQL Service

pgsql-service.jpg

PGSQL Activity

pgsql-activity.jpg

PGSQL Replication

pgsql-replication.jpg

PGSQL Databases

pgsql-databases.jpg

PGSQL Instance

pgsql-instance.jpg

PGSQL Proxy

pgsql-proxy.jpg

PGSQL Pgbouncer

pgsql-pgbouncer.jpg

PGSQL Session

pgsql-session.jpg

PGSQL Xacts

pgsql-xacts.jpg

PGSQL Persist

pgsql-persist.jpg

PGSQL Database

pgsql-database.jpg

PGSQL Tables

pgsql-tables.jpg

PGSQL Table

pgsql-table.jpg

PGSQL Query

pgsql-query.jpg

PGCAT Instance

pgcat-instance.jpg

PGCAT Database

pgcat-database.jpg

PGCAT Schema

pgcat-schema.jpg

PGCAT Table

pgcat-table.jpg

PGCAT Lock

pgcat-locks.jpg

PGCAT Query

pgcat-query.jpg

PGLOG Overview

pglog-overview.jpg

PGLOG Session

pglog-session.jpg

2 - Metrics List

Complete list and explanation of monitoring metrics provided by the Pigsty PGSQL module

The PGSQL module contains 638 types of available monitoring metrics.

Metric NameTypeLabelsDescription
ALERTSUnknowncategory, job, level, ins, severity, ip, alertname, alertstate, instance, clsN/A
ALERTS_FOR_STATEUnknowncategory, job, level, ins, severity, ip, alertname, instance, clsN/A
cls:pressure1Unknownjob, clsN/A
cls:pressure15Unknownjob, clsN/A
cls:pressure5Unknownjob, clsN/A
go_gc_duration_secondssummaryjob, ins, ip, instance, quantile, clsA summary of the pause duration of garbage collection cycles.
go_gc_duration_seconds_countUnknownjob, ins, ip, instance, clsN/A
go_gc_duration_seconds_sumUnknownjob, ins, ip, instance, clsN/A
go_goroutinesgaugejob, ins, ip, instance, clsNumber of goroutines that currently exist.
go_infogaugeversion, job, ins, ip, instance, clsInformation about the Go environment.
go_memstats_alloc_bytesgaugejob, ins, ip, instance, clsNumber of bytes allocated and still in use.
go_memstats_alloc_bytes_totalcounterjob, ins, ip, instance, clsTotal number of bytes allocated, even if freed.
go_memstats_buck_hash_sys_bytesgaugejob, ins, ip, instance, clsNumber of bytes used by the profiling bucket hash table.
go_memstats_frees_totalcounterjob, ins, ip, instance, clsTotal number of frees.
go_memstats_gc_sys_bytesgaugejob, ins, ip, instance, clsNumber of bytes used for garbage collection system metadata.
go_memstats_heap_alloc_bytesgaugejob, ins, ip, instance, clsNumber of heap bytes allocated and still in use.
go_memstats_heap_idle_bytesgaugejob, ins, ip, instance, clsNumber of heap bytes waiting to be used.
go_memstats_heap_inuse_bytesgaugejob, ins, ip, instance, clsNumber of heap bytes that are in use.
go_memstats_heap_objectsgaugejob, ins, ip, instance, clsNumber of allocated objects.
go_memstats_heap_released_bytesgaugejob, ins, ip, instance, clsNumber of heap bytes released to OS.
go_memstats_heap_sys_bytesgaugejob, ins, ip, instance, clsNumber of heap bytes obtained from system.
go_memstats_last_gc_time_secondsgaugejob, ins, ip, instance, clsNumber of seconds since 1970 of last garbage collection.
go_memstats_lookups_totalcounterjob, ins, ip, instance, clsTotal number of pointer lookups.
go_memstats_mallocs_totalcounterjob, ins, ip, instance, clsTotal number of mallocs.
go_memstats_mcache_inuse_bytesgaugejob, ins, ip, instance, clsNumber of bytes in use by mcache structures.
go_memstats_mcache_sys_bytesgaugejob, ins, ip, instance, clsNumber of bytes used for mcache structures obtained from system.
go_memstats_mspan_inuse_bytesgaugejob, ins, ip, instance, clsNumber of bytes in use by mspan structures.
go_memstats_mspan_sys_bytesgaugejob, ins, ip, instance, clsNumber of bytes used for mspan structures obtained from system.
go_memstats_next_gc_bytesgaugejob, ins, ip, instance, clsNumber of heap bytes when next garbage collection will take place.
go_memstats_other_sys_bytesgaugejob, ins, ip, instance, clsNumber of bytes used for other system allocations.
go_memstats_stack_inuse_bytesgaugejob, ins, ip, instance, clsNumber of bytes in use by the stack allocator.
go_memstats_stack_sys_bytesgaugejob, ins, ip, instance, clsNumber of bytes obtained from system for stack allocator.
go_memstats_sys_bytesgaugejob, ins, ip, instance, clsNumber of bytes obtained from system.
go_threadsgaugejob, ins, ip, instance, clsNumber of OS threads created.
ins:pressure1Unknownjob, ins, ip, clsN/A
ins:pressure15Unknownjob, ins, ip, clsN/A
ins:pressure5Unknownjob, ins, ip, clsN/A
patroni_cluster_unlockedgaugejob, ins, ip, instance, cls, scopeValue is 1 if the cluster is unlocked, 0 if locked.
patroni_dcs_last_seengaugejob, ins, ip, instance, cls, scopeEpoch timestamp when DCS was last contacted successfully by Patroni.
patroni_failsafe_mode_is_activegaugejob, ins, ip, instance, cls, scopeValue is 1 if failsafe mode is active, 0 if inactive.
patroni_is_pausedgaugejob, ins, ip, instance, cls, scopeValue is 1 if auto failover is disabled, 0 otherwise.
patroni_mastergaugejob, ins, ip, instance, cls, scopeValue is 1 if this node is the leader, 0 otherwise.
patroni_pending_restartgaugejob, ins, ip, instance, cls, scopeValue is 1 if the node needs a restart, 0 otherwise.
patroni_postgres_in_archive_recoverygaugejob, ins, ip, instance, cls, scopeValue is 1 if Postgres is replicating from archive, 0 otherwise.
patroni_postgres_runninggaugejob, ins, ip, instance, cls, scopeValue is 1 if Postgres is running, 0 otherwise.
patroni_postgres_server_versiongaugejob, ins, ip, instance, cls, scopeVersion of Postgres (if running), 0 otherwise.
patroni_postgres_streaminggaugejob, ins, ip, instance, cls, scopeValue is 1 if Postgres is streaming, 0 otherwise.
patroni_postgres_timelinecounterjob, ins, ip, instance, cls, scopePostgres timeline of this node (if running), 0 otherwise.
patroni_postmaster_start_timegaugejob, ins, ip, instance, cls, scopeEpoch seconds since Postgres started.
patroni_primarygaugejob, ins, ip, instance, cls, scopeValue is 1 if this node is the leader, 0 otherwise.
patroni_replicagaugejob, ins, ip, instance, cls, scopeValue is 1 if this node is a replica, 0 otherwise.
patroni_standby_leadergaugejob, ins, ip, instance, cls, scopeValue is 1 if this node is the standby_leader, 0 otherwise.
patroni_sync_standbygaugejob, ins, ip, instance, cls, scopeValue is 1 if this node is a sync standby replica, 0 otherwise.
patroni_upUnknownjob, ins, ip, instance, clsN/A
patroni_versiongaugejob, ins, ip, instance, cls, scopePatroni semver without periods.
patroni_xlog_locationcounterjob, ins, ip, instance, cls, scopeCurrent location of the Postgres transaction log, 0 if this node is not the leader.
patroni_xlog_pausedgaugejob, ins, ip, instance, cls, scopeValue is 1 if the Postgres xlog is paused, 0 otherwise.
patroni_xlog_received_locationcounterjob, ins, ip, instance, cls, scopeCurrent location of the received Postgres transaction log, 0 if this node is not a replica.
patroni_xlog_replayed_locationcounterjob, ins, ip, instance, cls, scopeCurrent location of the replayed Postgres transaction log, 0 if this node is not a replica.
patroni_xlog_replayed_timestampgaugejob, ins, ip, instance, cls, scopeCurrent timestamp of the replayed Postgres transaction log, 0 if null.
pg:cls:active_backendsUnknownjob, clsN/A
pg:cls:active_time_rate15mUnknownjob, clsN/A
pg:cls:active_time_rate1mUnknownjob, clsN/A
pg:cls:active_time_rate5mUnknownjob, clsN/A
pg:cls:ageUnknownjob, clsN/A
pg:cls:buf_alloc_rate1mUnknownjob, clsN/A
pg:cls:buf_clean_rate1mUnknownjob, clsN/A
pg:cls:buf_flush_backend_rate1mUnknownjob, clsN/A
pg:cls:buf_flush_checkpoint_rate1mUnknownjob, clsN/A
pg:cls:cpu_countUnknownjob, clsN/A
pg:cls:cpu_usageUnknownjob, clsN/A
pg:cls:cpu_usage_15mUnknownjob, clsN/A
pg:cls:cpu_usage_1mUnknownjob, clsN/A
pg:cls:cpu_usage_5mUnknownjob, clsN/A
pg:cls:db_sizeUnknownjob, clsN/A
pg:cls:file_sizeUnknownjob, clsN/A
pg:cls:ixact_backendsUnknownjob, clsN/A
pg:cls:ixact_time_rate1mUnknownjob, clsN/A
pg:cls:lag_bytesUnknownjob, clsN/A
pg:cls:lag_secondsUnknownjob, clsN/A
pg:cls:leaderUnknownjob, ins, ip, instance, clsN/A
pg:cls:load1Unknownjob, clsN/A
pg:cls:load15Unknownjob, clsN/A
pg:cls:load5Unknownjob, clsN/A
pg:cls:lock_countUnknownjob, clsN/A
pg:cls:locksUnknownjob, cls, modeN/A
pg:cls:log_sizeUnknownjob, clsN/A
pg:cls:lsn_rate1mUnknownjob, clsN/A
pg:cls:membersUnknownjob, ins, ip, clsN/A
pg:cls:num_backendsUnknownjob, clsN/A
pg:cls:partitionUnknownjob, clsN/A
pg:cls:receiverUnknownstate, slot_name, job, appname, ip, cls, sender_host, sender_portN/A
pg:cls:rlock_countUnknownjob, clsN/A
pg:cls:saturation1Unknownjob, clsN/A
pg:cls:saturation15Unknownjob, clsN/A
pg:cls:saturation5Unknownjob, clsN/A
pg:cls:senderUnknownpid, usename, address, job, ins, appname, ip, clsN/A
pg:cls:session_time_rate1mUnknownjob, clsN/A
pg:cls:sizeUnknownjob, clsN/A
pg:cls:slot_countUnknownjob, clsN/A
pg:cls:slot_retained_bytesUnknownjob, clsN/A
pg:cls:standby_countUnknownjob, clsN/A
pg:cls:sync_stateUnknownjob, clsN/A
pg:cls:timelineUnknownjob, clsN/A
pg:cls:tup_deleted_rate1mUnknownjob, clsN/A
pg:cls:tup_fetched_rate1mUnknownjob, clsN/A
pg:cls:tup_inserted_rate1mUnknownjob, clsN/A
pg:cls:tup_modified_rate1mUnknownjob, clsN/A
pg:cls:tup_returned_rate1mUnknownjob, clsN/A
pg:cls:wal_sizeUnknownjob, clsN/A
pg:cls:xact_commit_rate15mUnknownjob, clsN/A
pg:cls:xact_commit_rate1mUnknownjob, clsN/A
pg:cls:xact_commit_rate5mUnknownjob, clsN/A
pg:cls:xact_rollback_rate15mUnknownjob, clsN/A
pg:cls:xact_rollback_rate1mUnknownjob, clsN/A
pg:cls:xact_rollback_rate5mUnknownjob, clsN/A
pg:cls:xact_total_rate15mUnknownjob, clsN/A
pg:cls:xact_total_rate1mUnknownjob, clsN/A
pg:cls:xact_total_sigma15mUnknownjob, clsN/A
pg:cls:xlock_countUnknownjob, clsN/A
pg:db:active_backendsUnknowndatname, job, ins, ip, instance, clsN/A
pg:db:active_time_rate15mUnknowndatname, job, ins, ip, instance, clsN/A
pg:db:active_time_rate1mUnknowndatname, job, ins, ip, instance, clsN/A
pg:db:active_time_rate5mUnknowndatname, job, ins, ip, instance, clsN/A
pg:db:ageUnknowndatname, job, ins, ip, instance, clsN/A
pg:db:age_deriv1hUnknowndatname, job, ins, ip, instance, clsN/A
pg:db:age_exhaustUnknowndatname, job, ins, ip, instance, clsN/A
pg:db:blk_io_time_seconds_rate1mUnknowndatname, job, ins, ip, instance, clsN/A
pg:db:blk_read_time_seconds_rate1mUnknowndatname, job, ins, ip, instance, clsN/A
pg:db:blk_write_time_seconds_rate1mUnknowndatname, job, ins, ip, instance, clsN/A
pg:db:blks_access_1mUnknowndatname, job, ins, ip, instance, clsN/A
pg:db:blks_hit_1mUnknowndatname, job, ins, ip, instance, clsN/A
pg:db:blks_hit_ratio1mUnknowndatname, job, ins, ip, instance, clsN/A
pg:db:blks_read_1mUnknowndatname, job, ins, ip, instance, clsN/A
pg:db:conn_limitUnknowndatname, job, ins, ip, instance, clsN/A
pg:db:conn_usageUnknowndatname, job, ins, ip, instance, clsN/A
pg:db:db_sizeUnknowndatname, job, ins, ip, instance, clsN/A
pg:db:ixact_backendsUnknowndatname, job, ins, ip, instance, clsN/A
pg:db:ixact_time_rate1mUnknowndatname, job, ins, ip, instance, clsN/A
pg:db:lock_countUnknowndatname, job, ins, ip, instance, clsN/A
pg:db:num_backendsUnknowndatname, job, ins, ip, instance, clsN/A
pg:db:rlock_countUnknowndatname, job, ins, ip, instance, clsN/A
pg:db:session_time_rate1mUnknowndatname, job, ins, ip, instance, clsN/A
pg:db:temp_bytes_rate1mUnknowndatname, job, ins, ip, instance, clsN/A
pg:db:temp_files_1mUnknowndatname, job, ins, ip, instance, clsN/A
pg:db:tup_deleted_rate1mUnknowndatname, job, ins, ip, instance, clsN/A
pg:db:tup_fetched_rate1mUnknowndatname, job, ins, ip, instance, clsN/A
pg:db:tup_inserted_rate1mUnknowndatname, job, ins, ip, instance, clsN/A
pg:db:tup_modified_rate1mUnknowndatname, job, ins, ip, instance, clsN/A
pg:db:tup_returned_rate1mUnknowndatname, job, ins, ip, instance, clsN/A
pg:db:wlock_countUnknowndatname, job, ins, ip, instance, clsN/A
pg:db:xact_commit_rate15mUnknowndatname, job, ins, ip, instance, clsN/A
pg:db:xact_commit_rate1mUnknowndatname, job, ins, ip, instance, clsN/A
pg:db:xact_commit_rate5mUnknowndatname, job, ins, ip, instance, clsN/A
pg:db:xact_rollback_rate15mUnknowndatname, job, ins, ip, instance, clsN/A
pg:db:xact_rollback_rate1mUnknowndatname, job, ins, ip, instance, clsN/A
pg:db:xact_rollback_rate5mUnknowndatname, job, ins, ip, instance, clsN/A
pg:db:xact_total_rate15mUnknowndatname, job, ins, ip, instance, clsN/A
pg:db:xact_total_rate1mUnknowndatname, job, ins, ip, instance, clsN/A
pg:db:xact_total_rate5mUnknowndatname, job, ins, ip, instance, clsN/A
pg:db:xact_total_sigma15mUnknowndatname, job, ins, ip, instance, clsN/A
pg:db:xlock_countUnknowndatname, job, ins, ip, instance, clsN/A
pg:env:active_backendsUnknownjobN/A
pg:env:active_time_rate15mUnknownjobN/A
pg:env:active_time_rate1mUnknownjobN/A
pg:env:active_time_rate5mUnknownjobN/A
pg:env:ageUnknownjobN/A
pg:env:cpu_countUnknownjobN/A
pg:env:cpu_usageUnknownjobN/A
pg:env:cpu_usage_15mUnknownjobN/A
pg:env:cpu_usage_1mUnknownjobN/A
pg:env:cpu_usage_5mUnknownjobN/A
pg:env:ixact_backendsUnknownjobN/A
pg:env:ixact_time_rate1mUnknownjobN/A
pg:env:lag_bytesUnknownjobN/A
pg:env:lag_secondsUnknownjobN/A
pg:env:lsn_rate1mUnknownjobN/A
pg:env:session_time_rate1mUnknownjobN/A
pg:env:tup_deleted_rate1mUnknownjobN/A
pg:env:tup_fetched_rate1mUnknownjobN/A
pg:env:tup_inserted_rate1mUnknownjobN/A
pg:env:tup_modified_rate1mUnknownjobN/A
pg:env:tup_returned_rate1mUnknownjobN/A
pg:env:xact_commit_rate15mUnknownjobN/A
pg:env:xact_commit_rate1mUnknownjobN/A
pg:env:xact_commit_rate5mUnknownjobN/A
pg:env:xact_rollback_rate15mUnknownjobN/A
pg:env:xact_rollback_rate1mUnknownjobN/A
pg:env:xact_rollback_rate5mUnknownjobN/A
pg:env:xact_total_rate15mUnknownjobN/A
pg:env:xact_total_rate1mUnknownjobN/A
pg:env:xact_total_sigma15mUnknownjobN/A
pg:ins:active_backendsUnknownjob, ins, ip, instance, clsN/A
pg:ins:active_time_rate15mUnknownjob, ins, ip, instance, clsN/A
pg:ins:active_time_rate1mUnknownjob, ins, ip, instance, clsN/A
pg:ins:active_time_rate5mUnknownjob, ins, ip, instance, clsN/A
pg:ins:ageUnknownjob, ins, ip, instance, clsN/A
pg:ins:blks_hit_ratio1mUnknownjob, ins, ip, instance, clsN/A
pg:ins:buf_alloc_rate1mUnknownjob, ins, ip, instance, clsN/A
pg:ins:buf_clean_rate1mUnknownjob, ins, ip, instance, clsN/A
pg:ins:buf_flush_backend_rate1mUnknownjob, ins, ip, instance, clsN/A
pg:ins:buf_flush_checkpoint_rate1mUnknownjob, ins, ip, instance, clsN/A
pg:ins:ckpt_1hUnknownjob, ins, ip, instance, clsN/A
pg:ins:ckpt_req_1mUnknownjob, ins, ip, instance, clsN/A
pg:ins:ckpt_timed_1mUnknownjob, ins, ip, instance, clsN/A
pg:ins:conn_limitUnknownjob, ins, ip, instance, clsN/A
pg:ins:conn_usageUnknownjob, ins, ip, instance, clsN/A
pg:ins:cpu_countUnknownjob, ins, ip, instance, clsN/A
pg:ins:cpu_usageUnknownjob, ins, ip, instance, clsN/A
pg:ins:cpu_usage_15mUnknownjob, ins, ip, instance, clsN/A
pg:ins:cpu_usage_1mUnknownjob, ins, ip, instance, clsN/A
pg:ins:cpu_usage_5mUnknownjob, ins, ip, instance, clsN/A
pg:ins:db_sizeUnknownjob, ins, ip, instance, clsN/A
pg:ins:file_sizeUnknownjob, ins, ip, instance, clsN/A
pg:ins:fs_sizeUnknownjob, ins, ip, instance, clsN/A
pg:ins:is_leaderUnknownjob, ins, ip, instance, clsN/A
pg:ins:ixact_backendsUnknownjob, ins, ip, instance, clsN/A
pg:ins:ixact_time_rate1mUnknownjob, ins, ip, instance, clsN/A
pg:ins:lag_bytesUnknownjob, ins, ip, instance, clsN/A
pg:ins:lag_secondsUnknownjob, ins, ip, instance, clsN/A
pg:ins:load1Unknownjob, ins, ip, instance, clsN/A
pg:ins:load15Unknownjob, ins, ip, instance, clsN/A
pg:ins:load5Unknownjob, ins, ip, instance, clsN/A
pg:ins:lock_countUnknownjob, ins, ip, instance, clsN/A
pg:ins:locksUnknownjob, ins, ip, mode, instance, clsN/A
pg:ins:log_sizeUnknownjob, ins, ip, instance, clsN/A
pg:ins:lsn_rate1mUnknownjob, ins, ip, instance, clsN/A
pg:ins:mem_sizeUnknownjob, ins, ip, instance, clsN/A
pg:ins:num_backendsUnknownjob, ins, ip, instance, clsN/A
pg:ins:rlock_countUnknownjob, ins, ip, instance, clsN/A
pg:ins:saturation1Unknownjob, ins, ip, clsN/A
pg:ins:saturation15Unknownjob, ins, ip, clsN/A
pg:ins:saturation5Unknownjob, ins, ip, clsN/A
pg:ins:session_time_rate1mUnknownjob, ins, ip, instance, clsN/A
pg:ins:slot_retained_bytesUnknownjob, ins, ip, instance, clsN/A
pg:ins:space_usageUnknownjob, ins, ip, instance, clsN/A
pg:ins:statusUnknownjob, ins, ip, instance, clsN/A
pg:ins:sync_stateUnknownjob, ins, instance, clsN/A
pg:ins:target_countUnknownjob, cls, insN/A
pg:ins:timelineUnknownjob, ins, ip, instance, clsN/A
pg:ins:tup_deleted_rate1mUnknownjob, ins, ip, instance, clsN/A
pg:ins:tup_fetched_rate1mUnknownjob, ins, ip, instance, clsN/A
pg:ins:tup_inserted_rate1mUnknownjob, ins, ip, instance, clsN/A
pg:ins:tup_modified_rate1mUnknownjob, ins, ip, instance, clsN/A
pg:ins:tup_returned_rate1mUnknownjob, ins, ip, instance, clsN/A
pg:ins:wal_sizeUnknownjob, ins, ip, instance, clsN/A
pg:ins:wlock_countUnknownjob, ins, ip, instance, clsN/A
pg:ins:xact_commit_rate15mUnknownjob, ins, ip, instance, clsN/A
pg:ins:xact_commit_rate1mUnknownjob, ins, ip, instance, clsN/A
pg:ins:xact_commit_rate5mUnknownjob, ins, ip, instance, clsN/A
pg:ins:xact_rollback_rate15mUnknownjob, ins, ip, instance, clsN/A
pg:ins:xact_rollback_rate1mUnknownjob, ins, ip, instance, clsN/A
pg:ins:xact_rollback_rate5mUnknownjob, ins, ip, instance, clsN/A
pg:ins:xact_total_rate15mUnknownjob, ins, ip, instance, clsN/A
pg:ins:xact_total_rate1mUnknownjob, ins, ip, instance, clsN/A
pg:ins:xact_total_rate5mUnknownjob, ins, ip, instance, clsN/A
pg:ins:xact_total_sigma15mUnknownjob, ins, ip, instance, clsN/A
pg:ins:xlock_countUnknownjob, ins, ip, instance, clsN/A
pg:query:call_rate1mUnknowndatname, query, job, ins, ip, instance, clsN/A
pg:query:rt_1mUnknowndatname, query, job, ins, ip, instance, clsN/A
pg:table:scan_rate1mUnknowndatname, relname, job, ins, ip, instance, clsN/A
pg_activity_countgaugedatname, state, job, ins, ip, instance, clsCount of connection among (datname,state)
pg_activity_max_conn_durationgaugedatname, state, job, ins, ip, instance, clsMax backend session duration since state change among (datname, state)
pg_activity_max_durationgaugedatname, state, job, ins, ip, instance, clsMax duration since last state change among (datname, state)
pg_activity_max_tx_durationgaugedatname, state, job, ins, ip, instance, clsMax transaction duration since state change among (datname, state)
pg_archiver_failed_countcounterjob, ins, ip, instance, clsNumber of failed attempts for archiving WAL files
pg_archiver_finish_countcounterjob, ins, ip, instance, clsNumber of WAL files that have been successfully archived
pg_archiver_last_failed_timecounterjob, ins, ip, instance, clsTime of the last failed archival operation
pg_archiver_last_finish_timecounterjob, ins, ip, instance, clsTime of the last successful archive operation
pg_archiver_reset_timegaugejob, ins, ip, instance, clsTime at which archive statistics were last reset
pg_backend_countgaugetype, job, ins, ip, instance, clsDatabase backend process count by backend_type
pg_bgwriter_buffers_alloccounterjob, ins, ip, instance, clsNumber of buffers allocated
pg_bgwriter_buffers_backendcounterjob, ins, ip, instance, clsNumber of buffers written directly by a backend
pg_bgwriter_buffers_backend_fsynccounterjob, ins, ip, instance, clsNumber of times a backend had to execute its own fsync call
pg_bgwriter_buffers_checkpointcounterjob, ins, ip, instance, clsNumber of buffers written during checkpoints
pg_bgwriter_buffers_cleancounterjob, ins, ip, instance, clsNumber of buffers written by the background writer
pg_bgwriter_checkpoint_sync_timecounterjob, ins, ip, instance, clsTotal amount of time that has been spent in the portion of checkpoint processing where files are synchronized to disk, in seconds
pg_bgwriter_checkpoint_write_timecounterjob, ins, ip, instance, clsTotal amount of time that has been spent in the portion of checkpoint processing where files are written to disk, in seconds
pg_bgwriter_checkpoints_reqcounterjob, ins, ip, instance, clsNumber of requested checkpoints that have been performed
pg_bgwriter_checkpoints_timedcounterjob, ins, ip, instance, clsNumber of scheduled checkpoints that have been performed
pg_bgwriter_maxwritten_cleancounterjob, ins, ip, instance, clsNumber of times the background writer stopped a cleaning scan because it had written too many buffers
pg_bgwriter_reset_timecounterjob, ins, ip, instance, clsTime at which bgwriter statistics were last reset
pg_boot_timegaugejob, ins, ip, instance, clsunix timestamp when postmaster boot
pg_checkpoint_checkpoint_lsncounterjob, ins, ip, instance, clsLatest checkpoint location
pg_checkpoint_elapsegaugejob, ins, ip, instance, clsSeconds elapsed since latest checkpoint in seconds
pg_checkpoint_full_page_writesgaugejob, ins, ip, instance, clsLatest checkpoint’s full_page_writes enabled
pg_checkpoint_newest_commit_ts_xidcounterjob, ins, ip, instance, clsLatest checkpoint’s newestCommitTsXid
pg_checkpoint_next_multi_offsetcounterjob, ins, ip, instance, clsLatest checkpoint’s NextMultiOffset
pg_checkpoint_next_multixact_idcounterjob, ins, ip, instance, clsLatest checkpoint’s NextMultiXactId
pg_checkpoint_next_oidcounterjob, ins, ip, instance, clsLatest checkpoint’s NextOID
pg_checkpoint_next_xidcounterjob, ins, ip, instance, clsLatest checkpoint’s NextXID xid
pg_checkpoint_next_xid_epochcounterjob, ins, ip, instance, clsLatest checkpoint’s NextXID epoch
pg_checkpoint_oldest_active_xidcounterjob, ins, ip, instance, clsLatest checkpoint’s oldestActiveXID
pg_checkpoint_oldest_commit_ts_xidcounterjob, ins, ip, instance, clsLatest checkpoint’s oldestCommitTsXid
pg_checkpoint_oldest_multi_dbidgaugejob, ins, ip, instance, clsLatest checkpoint’s oldestMulti’s DB OID
pg_checkpoint_oldest_multi_xidcounterjob, ins, ip, instance, clsLatest checkpoint’s oldestMultiXid
pg_checkpoint_oldest_xidcounterjob, ins, ip, instance, clsLatest checkpoint’s oldestXID
pg_checkpoint_oldest_xid_dbidgaugejob, ins, ip, instance, clsLatest checkpoint’s oldestXID’s DB OID
pg_checkpoint_prev_tlicounterjob, ins, ip, instance, clsLatest checkpoint’s PrevTimeLineID
pg_checkpoint_redo_lsncounterjob, ins, ip, instance, clsLatest checkpoint’s REDO location
pg_checkpoint_timecounterjob, ins, ip, instance, clsTime of latest checkpoint
pg_checkpoint_tlicounterjob, ins, ip, instance, clsLatest checkpoint’s TimeLineID
pg_conf_reload_timegaugejob, ins, ip, instance, clsseconds since last configuration reload
pg_db_active_timecounterdatname, job, ins, ip, instance, clsTime spent executing SQL statements in this database, in seconds
pg_db_agegaugedatname, job, ins, ip, instance, clsAge of database calculated from datfrozenxid
pg_db_allow_conngaugedatname, job, ins, ip, instance, clsIf false(0) then no one can connect to this database.
pg_db_blk_read_timecounterdatname, job, ins, ip, instance, clsTime spent reading data file blocks by backends in this database, in seconds
pg_db_blk_write_timecounterdatname, job, ins, ip, instance, clsTime spent writing data file blocks by backends in this database, in seconds
pg_db_blks_accesscounterdatname, job, ins, ip, instance, clsNumber of times disk blocks that accessed read+hit
pg_db_blks_hitcounterdatname, job, ins, ip, instance, clsNumber of times disk blocks were found already in the buffer cache
pg_db_blks_readcounterdatname, job, ins, ip, instance, clsNumber of disk blocks read in this database
pg_db_cks_fail_timegaugedatname, job, ins, ip, instance, clsTime at which the last data page checksum failure was detected in this database
pg_db_cks_failscounterdatname, job, ins, ip, instance, clsNumber of data page checksum failures detected in this database, -1 for not enabled
pg_db_confl_confl_bufferpincounterdatname, job, ins, ip, instance, clsNumber of queries in this database that have been canceled due to pinned buffers
pg_db_confl_confl_deadlockcounterdatname, job, ins, ip, instance, clsNumber of queries in this database that have been canceled due to deadlocks
pg_db_confl_confl_lockcounterdatname, job, ins, ip, instance, clsNumber of queries in this database that have been canceled due to lock timeouts
pg_db_confl_confl_snapshotcounterdatname, job, ins, ip, instance, clsNumber of queries in this database that have been canceled due to old snapshots
pg_db_confl_confl_tablespacecounterdatname, job, ins, ip, instance, clsNumber of queries in this database that have been canceled due to dropped tablespaces
pg_db_conflictscounterdatname, job, ins, ip, instance, clsNumber of queries canceled due to conflicts with recovery in this database
pg_db_conn_limitgaugedatname, job, ins, ip, instance, clsSets maximum number of concurrent connections that can be made to this database. -1 means no limit.
pg_db_datidgaugedatname, job, ins, ip, instance, clsOID of the database
pg_db_deadlockscounterdatname, job, ins, ip, instance, clsNumber of deadlocks detected in this database
pg_db_frozen_xidgaugedatname, job, ins, ip, instance, clsAll transaction IDs before this one have been frozened
pg_db_is_templategaugedatname, job, ins, ip, instance, clsIf true(1), then this database can be cloned by any user with CREATEDB privileges
pg_db_ixact_timecounterdatname, job, ins, ip, instance, clsTime spent idling while in a transaction in this database, in seconds
pg_db_numbackendsgaugedatname, job, ins, ip, instance, clsNumber of backends currently connected to this database
pg_db_reset_timecounterdatname, job, ins, ip, instance, clsTime at which database statistics were last reset
pg_db_session_timecounterdatname, job, ins, ip, instance, clsTime spent by database sessions in this database, in seconds
pg_db_sessionscounterdatname, job, ins, ip, instance, clsTotal number of sessions established to this database
pg_db_sessions_abandonedcounterdatname, job, ins, ip, instance, clsNumber of database sessions to this database that were terminated because connection to the client was lost
pg_db_sessions_fatalcounterdatname, job, ins, ip, instance, clsNumber of database sessions to this database that were terminated by fatal errors
pg_db_sessions_killedcounterdatname, job, ins, ip, instance, clsNumber of database sessions to this database that were terminated by operator intervention
pg_db_temp_bytescounterdatname, job, ins, ip, instance, clsTotal amount of data written to temporary files by queries in this database.
pg_db_temp_filescounterdatname, job, ins, ip, instance, clsNumber of temporary files created by queries in this database
pg_db_tup_deletedcounterdatname, job, ins, ip, instance, clsNumber of rows deleted by queries in this database
pg_db_tup_fetchedcounterdatname, job, ins, ip, instance, clsNumber of rows fetched by queries in this database
pg_db_tup_insertedcounterdatname, job, ins, ip, instance, clsNumber of rows inserted by queries in this database
pg_db_tup_modifiedcounterdatname, job, ins, ip, instance, clsNumber of rows modified by queries in this database
pg_db_tup_returnedcounterdatname, job, ins, ip, instance, clsNumber of rows returned by queries in this database
pg_db_tup_updatedcounterdatname, job, ins, ip, instance, clsNumber of rows updated by queries in this database
pg_db_xact_commitcounterdatname, job, ins, ip, instance, clsNumber of transactions in this database that have been committed
pg_db_xact_rollbackcounterdatname, job, ins, ip, instance, clsNumber of transactions in this database that have been rolled back
pg_db_xact_totalcounterdatname, job, ins, ip, instance, clsNumber of transactions in this database
pg_downstream_countgaugestate, job, ins, ip, instance, clsCount of corresponding state
pg_exporter_agent_upUnknownjob, ins, ip, instance, clsN/A
pg_exporter_last_scrape_timegaugejob, ins, ip, instance, clsseconds exporter spending on scrapping
pg_exporter_query_cache_ttlgaugedatname, query, job, ins, ip, instance, clstimes to live of query cache
pg_exporter_query_scrape_durationgaugedatname, query, job, ins, ip, instance, clsseconds query spending on scrapping
pg_exporter_query_scrape_error_countgaugedatname, query, job, ins, ip, instance, clstimes the query failed
pg_exporter_query_scrape_hit_countgaugedatname, query, job, ins, ip, instance, clsnumbers been scrapped from this query
pg_exporter_query_scrape_metric_countgaugedatname, query, job, ins, ip, instance, clsnumbers of metrics been scrapped from this query
pg_exporter_query_scrape_total_countgaugedatname, query, job, ins, ip, instance, clstimes exporter server was scraped for metrics
pg_exporter_scrape_durationgaugejob, ins, ip, instance, clsseconds exporter spending on scrapping
pg_exporter_scrape_error_countcounterjob, ins, ip, instance, clstimes exporter was scraped for metrics and failed
pg_exporter_scrape_total_countcounterjob, ins, ip, instance, clstimes exporter was scraped for metrics
pg_exporter_server_scrape_durationgaugedatname, job, ins, ip, instance, clsseconds exporter server spending on scrapping
pg_exporter_server_scrape_error_countUnknowndatname, job, ins, ip, instance, clsN/A
pg_exporter_server_scrape_total_countgaugedatname, job, ins, ip, instance, clstimes exporter server was scraped for metrics
pg_exporter_server_scrape_total_secondsgaugedatname, job, ins, ip, instance, clsseconds exporter server spending on scrapping
pg_exporter_upgaugejob, ins, ip, instance, clsalways be 1 if your could retrieve metrics
pg_exporter_uptimegaugejob, ins, ip, instance, clsseconds since exporter primary server inited
pg_flush_lsncounterjob, ins, ip, instance, clsprimary only, location of current wal syncing
pg_func_callscounterdatname, funcname, job, ins, ip, instance, clsNumber of times this function has been called
pg_func_self_timecounterdatname, funcname, job, ins, ip, instance, clsTotal time spent in this function itself, not including other functions called by it, in ms
pg_func_total_timecounterdatname, funcname, job, ins, ip, instance, clsTotal time spent in this function and all other functions called by it, in ms
pg_in_recoverygaugejob, ins, ip, instance, clsserver is in recovery mode? 1 for yes 0 for no
pg_index_idx_blks_hitcounterdatname, relname, job, ins, relid, ip, instance, cls, idxnameNumber of buffer hits in this index
pg_index_idx_blks_readcounterdatname, relname, job, ins, relid, ip, instance, cls, idxnameNumber of disk blocks read from this index
pg_index_idx_scancounterdatname, relname, job, ins, relid, ip, instance, cls, idxnameNumber of index scans initiated on this index
pg_index_idx_tup_fetchcounterdatname, relname, job, ins, relid, ip, instance, cls, idxnameNumber of live table rows fetched by simple index scans using this index
pg_index_idx_tup_readcounterdatname, relname, job, ins, relid, ip, instance, cls, idxnameNumber of index entries returned by scans on this index
pg_index_relpagesgaugedatname, relname, job, ins, relid, ip, instance, cls, idxnameSize of the on-disk representation of this index in pages
pg_index_reltuplesgaugedatname, relname, job, ins, relid, ip, instance, cls, idxnameEstimate relation tuples
pg_insert_lsncounterjob, ins, ip, instance, clsprimary only, location of current wal inserting
pg_io_evictionscountertype, job, ins, object, ip, context, instance, clsNumber of times a block has been written out from a shared or local buffer
pg_io_extend_timecountertype, job, ins, object, ip, context, instance, clsTime spent in extend operations in seconds
pg_io_extendscountertype, job, ins, object, ip, context, instance, clsNumber of relation extend operations, each of the size specified in op_bytes.
pg_io_fsync_timecountertype, job, ins, object, ip, context, instance, clsTime spent in fsync operations in seconds
pg_io_fsyncscountertype, job, ins, object, ip, context, instance, clsNumber of fsync calls. These are only tracked in context normal
pg_io_hitscountertype, job, ins, object, ip, context, instance, clsThe number of times a desired block was found in a shared buffer.
pg_io_op_bytesgaugetype, job, ins, object, ip, context, instance, clsThe number of bytes per unit of I/O read, written, or extended. 8192 by default
pg_io_read_timecountertype, job, ins, object, ip, context, instance, clsTime spent in read operations in seconds
pg_io_readscountertype, job, ins, object, ip, context, instance, clsNumber of read operations, each of the size specified in op_bytes.
pg_io_reset_timegaugetype, job, ins, object, ip, context, instance, clsTimestamp at which these statistics were last reset
pg_io_reusescountertype, job, ins, object, ip, context, instance, clsThe number of times an existing buffer in reused
pg_io_write_timecountertype, job, ins, object, ip, context, instance, clsTime spent in write operations in seconds
pg_io_writeback_timecountertype, job, ins, object, ip, context, instance, clsTime spent in writeback operations in seconds
pg_io_writebackscountertype, job, ins, object, ip, context, instance, clsNumber of units of size op_bytes which the process requested the kernel write out to permanent storage.
pg_io_writescountertype, job, ins, object, ip, context, instance, clsNumber of write operations, each of the size specified in op_bytes.
pg_is_in_recoverygaugejob, ins, ip, instance, cls1 if in recovery mode
pg_is_wal_replay_pausedgaugejob, ins, ip, instance, cls1 if wal play paused
pg_laggaugejob, ins, ip, instance, clsreplica only, replication lag in seconds
pg_last_replay_timegaugejob, ins, ip, instance, clstime when last transaction been replayed
pg_lock_countgaugedatname, job, ins, ip, mode, instance, clsNumber of locks of corresponding mode and database
pg_lsncounterjob, ins, ip, instance, clslog sequence number, current write location
pg_meta_infogaugecls, extensions, version, job, ins, primary_conninfo, conf_path, hba_path, ip, cluster_id, instance, listen_port, wal_level, ver_num, cluster_name, data_dirconstant 1
pg_query_callscounterdatname, query, job, ins, ip, instance, clsNumber of times the statement was executed
pg_query_exec_timecounterdatname, query, job, ins, ip, instance, clsTotal time spent executing the statement, in seconds
pg_query_io_timecounterdatname, query, job, ins, ip, instance, clsTotal time the statement spent reading and writing blocks, in seconds
pg_query_rowscounterdatname, query, job, ins, ip, instance, clsTotal number of rows retrieved or affected by the statement
pg_query_sblk_dirtiedcounterdatname, query, job, ins, ip, instance, clsTotal number of shared blocks dirtied by the statement
pg_query_sblk_hitcounterdatname, query, job, ins, ip, instance, clsTotal number of shared block cache hits by the statement
pg_query_sblk_readcounterdatname, query, job, ins, ip, instance, clsTotal number of shared blocks read by the statement
pg_query_sblk_writtencounterdatname, query, job, ins, ip, instance, clsTotal number of shared blocks written by the statement
pg_query_wal_bytescounterdatname, query, job, ins, ip, instance, clsTotal amount of WAL bytes generated by the statement
pg_receive_lsncounterjob, ins, ip, instance, clsreplica only, location of wal synced to disk
pg_recovery_backup_end_lsncounterjob, ins, ip, instance, clsBackup end location
pg_recovery_backup_start_lsncounterjob, ins, ip, instance, clsBackup start location
pg_recovery_min_lsncounterjob, ins, ip, instance, clsMinimum recovery ending location
pg_recovery_min_timelinecounterjob, ins, ip, instance, clsMin recovery ending loc’s timeline
pg_recovery_prefetch_block_distancegaugejob, ins, ip, instance, clsHow many blocks ahead the prefetcher is looking
pg_recovery_prefetch_hitcounterjob, ins, ip, instance, clsNumber of blocks not prefetched because they were already in the buffer pool
pg_recovery_prefetch_io_depthgaugejob, ins, ip, instance, clsHow many prefetches have been initiated but are not yet known to have completed
pg_recovery_prefetch_prefetchcounterjob, ins, ip, instance, clsNumber of blocks prefetched because they were not in the buffer pool
pg_recovery_prefetch_reset_timecounterjob, ins, ip, instance, clsTime at which these recovery prefetch statistics were last reset
pg_recovery_prefetch_skip_fpwgaugejob, ins, ip, instance, clsNumber of blocks not prefetched because a full page image was included in the WAL
pg_recovery_prefetch_skip_initcounterjob, ins, ip, instance, clsNumber of blocks not prefetched because they would be zero-initialized
pg_recovery_prefetch_skip_newcounterjob, ins, ip, instance, clsNumber of blocks not prefetched because they didn’t exist yet
pg_recovery_prefetch_skip_repcounterjob, ins, ip, instance, clsNumber of blocks not prefetched because they were already recently prefetched
pg_recovery_prefetch_wal_distancegaugejob, ins, ip, instance, clsHow many bytes ahead the prefetcher is looking
pg_recovery_require_recordgaugejob, ins, ip, instance, clsEnd-of-backup record required
pg_recv_flush_lsncounterstate, slot_name, job, ins, ip, instance, cls, sender_host, sender_portLast write-ahead log location already received and flushed to disk
pg_recv_flush_tlicounterstate, slot_name, job, ins, ip, instance, cls, sender_host, sender_portTimeline number of last write-ahead log location received and flushed to disk
pg_recv_init_lsncounterstate, slot_name, job, ins, ip, instance, cls, sender_host, sender_portFirst write-ahead log location used when WAL receiver is started
pg_recv_init_tlicounterstate, slot_name, job, ins, ip, instance, cls, sender_host, sender_portFirst timeline number used when WAL receiver is started
pg_recv_msg_recv_timegaugestate, slot_name, job, ins, ip, instance, cls, sender_host, sender_portReceipt time of last message received from origin WAL sender
pg_recv_msg_send_timegaugestate, slot_name, job, ins, ip, instance, cls, sender_host, sender_portSend time of last message received from origin WAL sender
pg_recv_pidgaugestate, slot_name, job, ins, ip, instance, cls, sender_host, sender_portProcess ID of the WAL receiver process
pg_recv_reported_lsncounterstate, slot_name, job, ins, ip, instance, cls, sender_host, sender_portLast write-ahead log location reported to origin WAL sender
pg_recv_reported_timegaugestate, slot_name, job, ins, ip, instance, cls, sender_host, sender_portTime of last write-ahead log location reported to origin WAL sender
pg_recv_timegaugestate, slot_name, job, ins, ip, instance, cls, sender_host, sender_portTime of current snapshot
pg_recv_write_lsncounterstate, slot_name, job, ins, ip, instance, cls, sender_host, sender_portLast write-ahead log location already received and written to disk, but not flushed.
pg_relkind_countgaugedatname, job, ins, ip, instance, cls, relkindNumber of relations of corresponding relkind
pg_repl_backend_xmincounterpid, usename, address, job, ins, appname, ip, instance, clsThis standby’s xmin horizon reported by hot_standby_feedback.
pg_repl_client_portgaugepid, usename, address, job, ins, appname, ip, instance, clsTCP port number that the client is using for communication with this WAL sender, or -1 if a Unix socket is used
pg_repl_flush_diffgaugepid, usename, address, job, ins, appname, ip, instance, clsLast log position flushed to disk by this standby server diff with current lsn
pg_repl_flush_laggaugepid, usename, address, job, ins, appname, ip, instance, clsTime elapsed between flushing recent WAL locally and receiving notification that this standby server has written and flushed it
pg_repl_flush_lsncounterpid, usename, address, job, ins, appname, ip, instance, clsLast write-ahead log location flushed to disk by this standby server
pg_repl_launch_timecounterpid, usename, address, job, ins, appname, ip, instance, clsTime when this process was started, i.e., when the client connected to this WAL sender
pg_repl_lsncounterpid, usename, address, job, ins, appname, ip, instance, clsCurrent log position on this server
pg_repl_replay_diffgaugepid, usename, address, job, ins, appname, ip, instance, clsLast log position replayed into the database on this standby server diff with current lsn
pg_repl_replay_laggaugepid, usename, address, job, ins, appname, ip, instance, clsTime elapsed between flushing recent WAL locally and receiving notification that this standby server has written, flushed and applied it
pg_repl_replay_lsncounterpid, usename, address, job, ins, appname, ip, instance, clsLast write-ahead log location replayed into the database on this standby server
pg_repl_reply_timegaugepid, usename, address, job, ins, appname, ip, instance, clsSend time of last reply message received from standby server
pg_repl_sent_diffgaugepid, usename, address, job, ins, appname, ip, instance, clsLast log position sent to this standby server diff with current lsn
pg_repl_sent_lsncounterpid, usename, address, job, ins, appname, ip, instance, clsLast write-ahead log location sent on this connection
pg_repl_stategaugepid, usename, address, job, ins, appname, ip, instance, clsCurrent WAL sender encoded state 0-4 for streaming startup catchup backup stopping
pg_repl_sync_prioritygaugepid, usename, address, job, ins, appname, ip, instance, clsPriority of this standby server for being chosen as the synchronous standby
pg_repl_sync_stategaugepid, usename, address, job, ins, appname, ip, instance, clsEncoded synchronous state of this standby server, 0-3 for async potential sync quorum
pg_repl_timecounterpid, usename, address, job, ins, appname, ip, instance, clsCurrent timestamp in unix epoch
pg_repl_write_diffgaugepid, usename, address, job, ins, appname, ip, instance, clsLast log position written to disk by this standby server diff with current lsn
pg_repl_write_laggaugepid, usename, address, job, ins, appname, ip, instance, clsTime elapsed between flushing recent WAL locally and receiving notification that this standby server has written it
pg_repl_write_lsncounterpid, usename, address, job, ins, appname, ip, instance, clsLast write-ahead log location written to disk by this standby server
pg_replay_lsncounterjob, ins, ip, instance, clsreplica only, location of wal applied
pg_seq_blks_hitcounterdatname, job, ins, ip, instance, cls, seqnameNumber of buffer hits in this sequence
pg_seq_blks_readcounterdatname, job, ins, ip, instance, cls, seqnameNumber of disk blocks read from this sequence
pg_seq_last_valuecounterdatname, job, ins, ip, instance, cls, seqnameThe last sequence value written to disk
pg_setting_block_sizegaugejob, ins, ip, instance, clspg page block size, 8192 by default
pg_setting_data_checksumsgaugejob, ins, ip, instance, clswhether data checksum is enabled, 1 enabled 0 disabled
pg_setting_max_connectionsgaugejob, ins, ip, instance, clsnumber of concurrent connections to the database server
pg_setting_max_locks_per_transactiongaugejob, ins, ip, instance, clsno more than this many distinct objects can be locked at any one time
pg_setting_max_prepared_transactionsgaugejob, ins, ip, instance, clsmaximum number of transactions that can be in the prepared state simultaneously
pg_setting_max_replication_slotsgaugejob, ins, ip, instance, clsmaximum number of replication slots
pg_setting_max_wal_sendersgaugejob, ins, ip, instance, clsmaximum number of concurrent connections from standby servers
pg_setting_max_worker_processesgaugejob, ins, ip, instance, clsmaximum number of background processes that the system can support
pg_setting_wal_log_hintsgaugejob, ins, ip, instance, clswhether wal_log_hints is enabled, 1 enabled 0 disabled
pg_size_bytesgaugedatname, job, ins, ip, instance, clsFile size in bytes
pg_slot_activegaugeslot_name, job, ins, ip, instance, clsTrue(1) if this slot is currently actively being used
pg_slot_catalog_xmincounterslot_name, job, ins, ip, instance, clsThe oldest transaction affecting the system catalogs that this slot needs the database to retain.
pg_slot_confirm_lsncounterslot_name, job, ins, ip, instance, clsThe address (LSN) up to which the logical slot’s consumer has confirmed receiving data.
pg_slot_reset_timecounterslot_name, job, ins, ip, instance, clsWhen statistics were last reset
pg_slot_restart_lsncounterslot_name, job, ins, ip, instance, clsThe address (LSN) of oldest WAL which still might be required by the consumer of this slot
pg_slot_retained_bytesgaugeslot_name, job, ins, ip, instance, clsSize of bytes that retained for this slot
pg_slot_safe_wal_sizegaugeslot_name, job, ins, ip, instance, clsbytes that can be written to WAL which will not make slot into lost
pg_slot_spill_bytescounterslot_name, job, ins, ip, instance, clsBytes that spilled to disk due to logical decode mem exceeding
pg_slot_spill_countcounterslot_name, job, ins, ip, instance, clsXacts that spilled to disk due to logical decode mem exceeding (a xact can be spilled multiple times)
pg_slot_spill_txnscounterslot_name, job, ins, ip, instance, clsXacts that spilled to disk due to logical decode mem exceeding (subtrans included)
pg_slot_stream_bytescounterslot_name, job, ins, ip, instance, clsBytes that streamed to decoding output plugin after mem exceed
pg_slot_stream_countcounterslot_name, job, ins, ip, instance, clsXacts that streamed to decoding output plugin after mem exceed (a xact can be streamed multiple times)
pg_slot_stream_txnscounterslot_name, job, ins, ip, instance, clsXacts that streamed to decoding output plugin after mem exceed
pg_slot_temporarygaugeslot_name, job, ins, ip, instance, clsTrue(1) if this is a temporary replication slot.
pg_slot_total_bytescounterslot_name, job, ins, ip, instance, clsNumber of decoded bytes sent to the decoding output plugin for this slot
pg_slot_total_txnscounterslot_name, job, ins, ip, instance, clsNumber of decoded xacts sent to the decoding output plugin for this slot
pg_slot_wal_statusgaugeslot_name, job, ins, ip, instance, clsWAL reserve status 0-3 means reserved,extended,unreserved,lost, -1 means other
pg_slot_xmincounterslot_name, job, ins, ip, instance, clsThe oldest transaction that this slot needs the database to retain.
pg_slru_blks_existscounterjob, ins, ip, instance, clsNumber of blocks checked for existence for this SLRU
pg_slru_blks_hitcounterjob, ins, ip, instance, clsNumber of times disk blocks were found already in the SLRU, so that a read was not necessary
pg_slru_blks_readcounterjob, ins, ip, instance, clsNumber of disk blocks read for this SLRU
pg_slru_blks_writtencounterjob, ins, ip, instance, clsNumber of disk blocks written for this SLRU
pg_slru_blks_zeroedcounterjob, ins, ip, instance, clsNumber of blocks zeroed during initializations
pg_slru_flushescounterjob, ins, ip, instance, clsNumber of flushes of dirty data for this SLRU
pg_slru_reset_timecounterjob, ins, ip, instance, clsTime at which these statistics were last reset
pg_slru_truncatescounterjob, ins, ip, instance, clsNumber of truncates for this SLRU
pg_ssl_disabledgaugejob, ins, ip, instance, clsNumber of client connection that does not use ssl
pg_ssl_enabledgaugejob, ins, ip, instance, clsNumber of client connection that use ssl
pg_sync_standby_enabledgaugejob, ins, ip, names, instance, clsSynchronous commit enabled, 1 if enabled, 0 if disabled
pg_table_agegaugedatname, relname, job, ins, ip, instance, clsAge of this table in vacuum cycles
pg_table_analyze_countcounterdatname, relname, job, ins, ip, instance, clsNumber of times this table has been manually analyzed
pg_table_autoanalyze_countcounterdatname, relname, job, ins, ip, instance, clsNumber of times this table has been analyzed by the autovacuum daemon
pg_table_autovacuum_countcounterdatname, relname, job, ins, ip, instance, clsNumber of times this table has been vacuumed by the autovacuum daemon
pg_table_frozenxidcounterdatname, relname, job, ins, ip, instance, clsAll txid before this have been frozen on this table
pg_table_heap_blks_hitcounterdatname, relname, job, ins, ip, instance, clsNumber of buffer hits in this table
pg_table_heap_blks_readcounterdatname, relname, job, ins, ip, instance, clsNumber of disk blocks read from this table
pg_table_idx_blks_hitcounterdatname, relname, job, ins, ip, instance, clsNumber of buffer hits in all indexes on this table
pg_table_idx_blks_readcounterdatname, relname, job, ins, ip, instance, clsNumber of disk blocks read from all indexes on this table
pg_table_idx_scancounterdatname, relname, job, ins, ip, instance, clsNumber of index scans initiated on this table
pg_table_idx_tup_fetchcounterdatname, relname, job, ins, ip, instance, clsNumber of live rows fetched by index scans
pg_table_kindgaugedatname, relname, job, ins, ip, instance, clsRelation kind r/table/114
pg_table_n_dead_tupgaugedatname, relname, job, ins, ip, instance, clsEstimated number of dead rows
pg_table_n_ins_since_vacuumgaugedatname, relname, job, ins, ip, instance, clsEstimated number of rows inserted since this table was last vacuumed
pg_table_n_live_tupgaugedatname, relname, job, ins, ip, instance, clsEstimated number of live rows
pg_table_n_mod_since_analyzegaugedatname, relname, job, ins, ip, instance, clsEstimated number of rows modified since this table was last analyzed
pg_table_n_tup_delcounterdatname, relname, job, ins, ip, instance, clsNumber of rows deleted
pg_table_n_tup_hot_updcounterdatname, relname, job, ins, ip, instance, clsNumber of rows HOT updated (i.e with no separate index update required)
pg_table_n_tup_inscounterdatname, relname, job, ins, ip, instance, clsNumber of rows inserted
pg_table_n_tup_modcounterdatname, relname, job, ins, ip, instance, clsNumber of rows modified (insert + update + delete)
pg_table_n_tup_newpage_updcounterdatname, relname, job, ins, ip, instance, clsNumber of rows updated where the successor version goes onto a new heap page
pg_table_n_tup_updcounterdatname, relname, job, ins, ip, instance, clsNumber of rows updated (includes HOT updated rows)
pg_table_ncolsgaugedatname, relname, job, ins, ip, instance, clsNumber of columns in the table
pg_table_pagesgaugedatname, relname, job, ins, ip, instance, clsSize of the on-disk representation of this table in pages
pg_table_relidgaugedatname, relname, job, ins, ip, instance, clsRelation oid of this table
pg_table_seq_scancounterdatname, relname, job, ins, ip, instance, clsNumber of sequential scans initiated on this table
pg_table_seq_tup_readcounterdatname, relname, job, ins, ip, instance, clsNumber of live rows fetched by sequential scans
pg_table_size_bytesgaugedatname, relname, job, ins, ip, instance, clsTotal bytes of this table (including toast, index, toast index)
pg_table_size_indexsizegaugedatname, relname, job, ins, ip, instance, clsBytes of all related indexes of this table
pg_table_size_relsizegaugedatname, relname, job, ins, ip, instance, clsBytes of this table itself (main, vm, fsm)
pg_table_size_toastsizegaugedatname, relname, job, ins, ip, instance, clsBytes of toast tables of this table
pg_table_tbl_scancounterdatname, relname, job, ins, ip, instance, clsNumber of scans initiated on this table
pg_table_tup_readcounterdatname, relname, job, ins, ip, instance, clsNumber of live rows fetched by scans
pg_table_tuplescounterdatname, relname, job, ins, ip, instance, clsAll txid before this have been frozen on this table
pg_table_vacuum_countcounterdatname, relname, job, ins, ip, instance, clsNumber of times this table has been manually vacuumed (not counting VACUUM FULL)
pg_timestampgaugejob, ins, ip, instance, clsdatabase current timestamp
pg_upgaugejob, ins, ip, instance, clslast scrape was able to connect to the server: 1 for yes, 0 for no
pg_uptimegaugejob, ins, ip, instance, clsseconds since postmaster start
pg_versiongaugejob, ins, ip, instance, clsserver version number
pg_wait_countgaugedatname, job, ins, event, ip, instance, clsCount of WaitEvent on target database
pg_wal_buffers_fullcounterjob, ins, ip, instance, clsNumber of times WAL data was written to disk because WAL buffers became full
pg_wal_bytescounterjob, ins, ip, instance, clsTotal amount of WAL generated in bytes
pg_wal_fpicounterjob, ins, ip, instance, clsTotal number of WAL full page images generated
pg_wal_recordscounterjob, ins, ip, instance, clsTotal number of WAL records generated
pg_wal_reset_timecounterjob, ins, ip, instance, clsWhen statistics were last reset
pg_wal_synccounterjob, ins, ip, instance, clsNumber of times WAL files were synced to disk via issue_xlog_fsync request
pg_wal_sync_timecounterjob, ins, ip, instance, clsTotal amount of time spent syncing WAL files to disk via issue_xlog_fsync request, in seconds
pg_wal_writecounterjob, ins, ip, instance, clsNumber of times WAL buffers were written out to disk via XLogWrite request.
pg_wal_write_timecounterjob, ins, ip, instance, clsTotal amount of time spent writing WAL buffers to disk via XLogWrite request in seconds
pg_write_lsncounterjob, ins, ip, instance, clsprimary only, location of current wal writing
pg_xact_xmaxcounterjob, ins, ip, instance, clsFirst as-yet-unassigned txid. txid >= this are invisible.
pg_xact_xmincounterjob, ins, ip, instance, clsEarliest txid that is still active
pg_xact_xnumgaugejob, ins, ip, instance, clsCurrent active transaction count
pgbouncer:cls:load1Unknownjob, clsN/A
pgbouncer:cls:load15Unknownjob, clsN/A
pgbouncer:cls:load5Unknownjob, clsN/A
pgbouncer:db:conn_usageUnknowndatname, job, ins, ip, instance, host, cls, real_datname, portN/A
pgbouncer:db:conn_usage_reserveUnknowndatname, job, ins, ip, instance, host, cls, real_datname, portN/A
pgbouncer:db:pool_current_connUnknowndatname, job, ins, ip, instance, host, cls, real_datname, portN/A
pgbouncer:db:pool_disabledUnknowndatname, job, ins, ip, instance, host, cls, real_datname, portN/A
pgbouncer:db:pool_max_connUnknowndatname, job, ins, ip, instance, host, cls, real_datname, portN/A
pgbouncer:db:pool_pausedUnknowndatname, job, ins, ip, instance, host, cls, real_datname, portN/A
pgbouncer:db:pool_reserve_sizeUnknowndatname, job, ins, ip, instance, host, cls, real_datname, portN/A
pgbouncer:db:pool_sizeUnknowndatname, job, ins, ip, instance, host, cls, real_datname, portN/A
pgbouncer:ins:free_clientsUnknownjob, ins, ip, instance, clsN/A
pgbouncer:ins:free_serversUnknownjob, ins, ip, instance, clsN/A
pgbouncer:ins:load1Unknownjob, ins, ip, instance, clsN/A
pgbouncer:ins:load15Unknownjob, ins, ip, instance, clsN/A
pgbouncer:ins:load5Unknownjob, ins, ip, instance, clsN/A
pgbouncer:ins:login_clientsUnknownjob, ins, ip, instance, clsN/A
pgbouncer:ins:pool_databasesUnknownjob, ins, ip, instance, clsN/A
pgbouncer:ins:pool_usersUnknownjob, ins, ip, instance, clsN/A
pgbouncer:ins:poolsUnknownjob, ins, ip, instance, clsN/A
pgbouncer:ins:used_clientsUnknownjob, ins, ip, instance, clsN/A
pgbouncer_database_current_connectionsgaugedatname, job, ins, ip, instance, host, cls, real_datname, portCurrent number of connections for this database
pgbouncer_database_disabledgaugedatname, job, ins, ip, instance, host, cls, real_datname, portTrue(1) if this database is currently disabled, else 0
pgbouncer_database_max_connectionsgaugedatname, job, ins, ip, instance, host, cls, real_datname, portMaximum number of allowed connections for this database
pgbouncer_database_min_pool_sizegaugedatname, job, ins, ip, instance, host, cls, real_datname, portMinimum number of server connections
pgbouncer_database_pausedgaugedatname, job, ins, ip, instance, host, cls, real_datname, portTrue(1) if this database is currently paused, else 0
pgbouncer_database_pool_sizegaugedatname, job, ins, ip, instance, host, cls, real_datname, portMaximum number of server connections
pgbouncer_database_reserve_poolgaugedatname, job, ins, ip, instance, host, cls, real_datname, portMaximum number of additional connections for this database
pgbouncer_exporter_agent_upUnknownjob, ins, ip, instance, clsN/A
pgbouncer_exporter_last_scrape_timegaugejob, ins, ip, instance, clsseconds exporter spending on scrapping
pgbouncer_exporter_query_cache_ttlgaugedatname, query, job, ins, ip, instance, clstimes to live of query cache
pgbouncer_exporter_query_scrape_durationgaugedatname, query, job, ins, ip, instance, clsseconds query spending on scrapping
pgbouncer_exporter_query_scrape_error_countgaugedatname, query, job, ins, ip, instance, clstimes the query failed
pgbouncer_exporter_query_scrape_hit_countgaugedatname, query, job, ins, ip, instance, clsnumbers been scrapped from this query
pgbouncer_exporter_query_scrape_metric_countgaugedatname, query, job, ins, ip, instance, clsnumbers of metrics been scrapped from this query
pgbouncer_exporter_query_scrape_total_countgaugedatname, query, job, ins, ip, instance, clstimes exporter server was scraped for metrics
pgbouncer_exporter_scrape_durationgaugejob, ins, ip, instance, clsseconds exporter spending on scrapping
pgbouncer_exporter_scrape_error_countcounterjob, ins, ip, instance, clstimes exporter was scraped for metrics and failed
pgbouncer_exporter_scrape_total_countcounterjob, ins, ip, instance, clstimes exporter was scraped for metrics
pgbouncer_exporter_server_scrape_durationgaugedatname, job, ins, ip, instance, clsseconds exporter server spending on scrapping
pgbouncer_exporter_server_scrape_total_countgaugedatname, job, ins, ip, instance, clstimes exporter server was scraped for metrics
pgbouncer_exporter_server_scrape_total_secondsgaugedatname, job, ins, ip, instance, clsseconds exporter server spending on scrapping
pgbouncer_exporter_upgaugejob, ins, ip, instance, clsalways be 1 if your could retrieve metrics
pgbouncer_exporter_uptimegaugejob, ins, ip, instance, clsseconds since exporter primary server inited
pgbouncer_in_recoverygaugejob, ins, ip, instance, clsserver is in recovery mode? 1 for yes 0 for no
pgbouncer_list_itemsgaugejob, ins, ip, instance, list, clsNumber of corresponding pgbouncer object
pgbouncer_pool_active_cancel_clientsgaugedatname, job, ins, ip, instance, user, cls, pool_modeClient connections that have forwarded query cancellations to the server and are waiting for the server response.
pgbouncer_pool_active_cancel_serversgaugedatname, job, ins, ip, instance, user, cls, pool_modeServer connections that are currently forwarding a cancel request
pgbouncer_pool_active_clientsgaugedatname, job, ins, ip, instance, user, cls, pool_modeClient connections that are linked to server connection and can process queries
pgbouncer_pool_active_serversgaugedatname, job, ins, ip, instance, user, cls, pool_modeServer connections that are linked to a client
pgbouncer_pool_cancel_clientsgaugedatname, job, ins, ip, instance, user, cls, pool_modeClient connections that have not forwarded query cancellations to the server yet.
pgbouncer_pool_cancel_serversgaugedatname, job, ins, ip, instance, user, cls, pool_modecancel requests have completed that were sent to cancel a query on this server
pgbouncer_pool_idle_serversgaugedatname, job, ins, ip, instance, user, cls, pool_modeServer connections that are unused and immediately usable for client queries
pgbouncer_pool_login_serversgaugedatname, job, ins, ip, instance, user, cls, pool_modeServer connections currently in the process of logging in
pgbouncer_pool_maxwaitgaugedatname, job, ins, ip, instance, user, cls, pool_modeHow long the first(oldest) client in the queue has waited, in seconds, key metric
pgbouncer_pool_maxwait_usgaugedatname, job, ins, ip, instance, user, cls, pool_modeMicrosecond part of the maximum waiting time.
pgbouncer_pool_tested_serversgaugedatname, job, ins, ip, instance, user, cls, pool_modeServer connections that are currently running reset or check query
pgbouncer_pool_used_serversgaugedatname, job, ins, ip, instance, user, cls, pool_modeServer connections that have been idle for more than server_check_delay (means have to run check query)
pgbouncer_pool_waiting_clientsgaugedatname, job, ins, ip, instance, user, cls, pool_modeClient connections that have sent queries but have not yet got a server connection
pgbouncer_stat_avg_query_countgaugedatname, job, ins, ip, instance, clsAverage queries per second in last stat period
pgbouncer_stat_avg_query_timegaugedatname, job, ins, ip, instance, clsAverage query duration, in seconds
pgbouncer_stat_avg_recvgaugedatname, job, ins, ip, instance, clsAverage received (from clients) bytes per second
pgbouncer_stat_avg_sentgaugedatname, job, ins, ip, instance, clsAverage sent (to clients) bytes per second
pgbouncer_stat_avg_wait_timegaugedatname, job, ins, ip, instance, clsTime spent by clients waiting for a server, in seconds (average per second).
pgbouncer_stat_avg_xact_countgaugedatname, job, ins, ip, instance, clsAverage transactions per second in last stat period
pgbouncer_stat_avg_xact_timegaugedatname, job, ins, ip, instance, clsAverage transaction duration, in seconds
pgbouncer_stat_total_query_countgaugedatname, job, ins, ip, instance, clsTotal number of SQL queries pooled by pgbouncer
pgbouncer_stat_total_query_timecounterdatname, job, ins, ip, instance, clsTotal number of seconds spent when executing queries
pgbouncer_stat_total_receivedcounterdatname, job, ins, ip, instance, clsTotal volume in bytes of network traffic received by pgbouncer
pgbouncer_stat_total_sentcounterdatname, job, ins, ip, instance, clsTotal volume in bytes of network traffic sent by pgbouncer
pgbouncer_stat_total_wait_timecounterdatname, job, ins, ip, instance, clsTime spent by clients waiting for a server, in seconds
pgbouncer_stat_total_xact_countgaugedatname, job, ins, ip, instance, clsTotal number of SQL transactions pooled by pgbouncer
pgbouncer_stat_total_xact_timecounterdatname, job, ins, ip, instance, clsTotal number of seconds spent when in a transaction
pgbouncer_upgaugejob, ins, ip, instance, clslast scrape was able to connect to the server: 1 for yes, 0 for no
pgbouncer_versiongaugejob, ins, ip, instance, clsserver version number
process_cpu_seconds_totalcounterjob, ins, ip, instance, clsTotal user and system CPU time spent in seconds.
process_max_fdsgaugejob, ins, ip, instance, clsMaximum number of open file descriptors.
process_open_fdsgaugejob, ins, ip, instance, clsNumber of open file descriptors.
process_resident_memory_bytesgaugejob, ins, ip, instance, clsResident memory size in bytes.
process_start_time_secondsgaugejob, ins, ip, instance, clsStart time of the process since unix epoch in seconds.
process_virtual_memory_bytesgaugejob, ins, ip, instance, clsVirtual memory size in bytes.
process_virtual_memory_max_bytesgaugejob, ins, ip, instance, clsMaximum amount of virtual memory available in bytes.
promhttp_metric_handler_requests_in_flightgaugejob, ins, ip, instance, clsCurrent number of scrapes being served.
promhttp_metric_handler_requests_totalcountercode, job, ins, ip, instance, clsTotal number of scrapes by HTTP status code.
scrape_duration_secondsUnknownjob, ins, ip, instance, clsN/A
scrape_samples_post_metric_relabelingUnknownjob, ins, ip, instance, clsN/A
scrape_samples_scrapedUnknownjob, ins, ip, instance, clsN/A
scrape_series_addedUnknownjob, ins, ip, instance, clsN/A
upUnknownjob, ins, ip, instance, clsN/A