Monitoring How to monitor Redis? What alert rules are worth paying attention to?
Dashboards The REDIS module provides 3 monitoring dashboards:
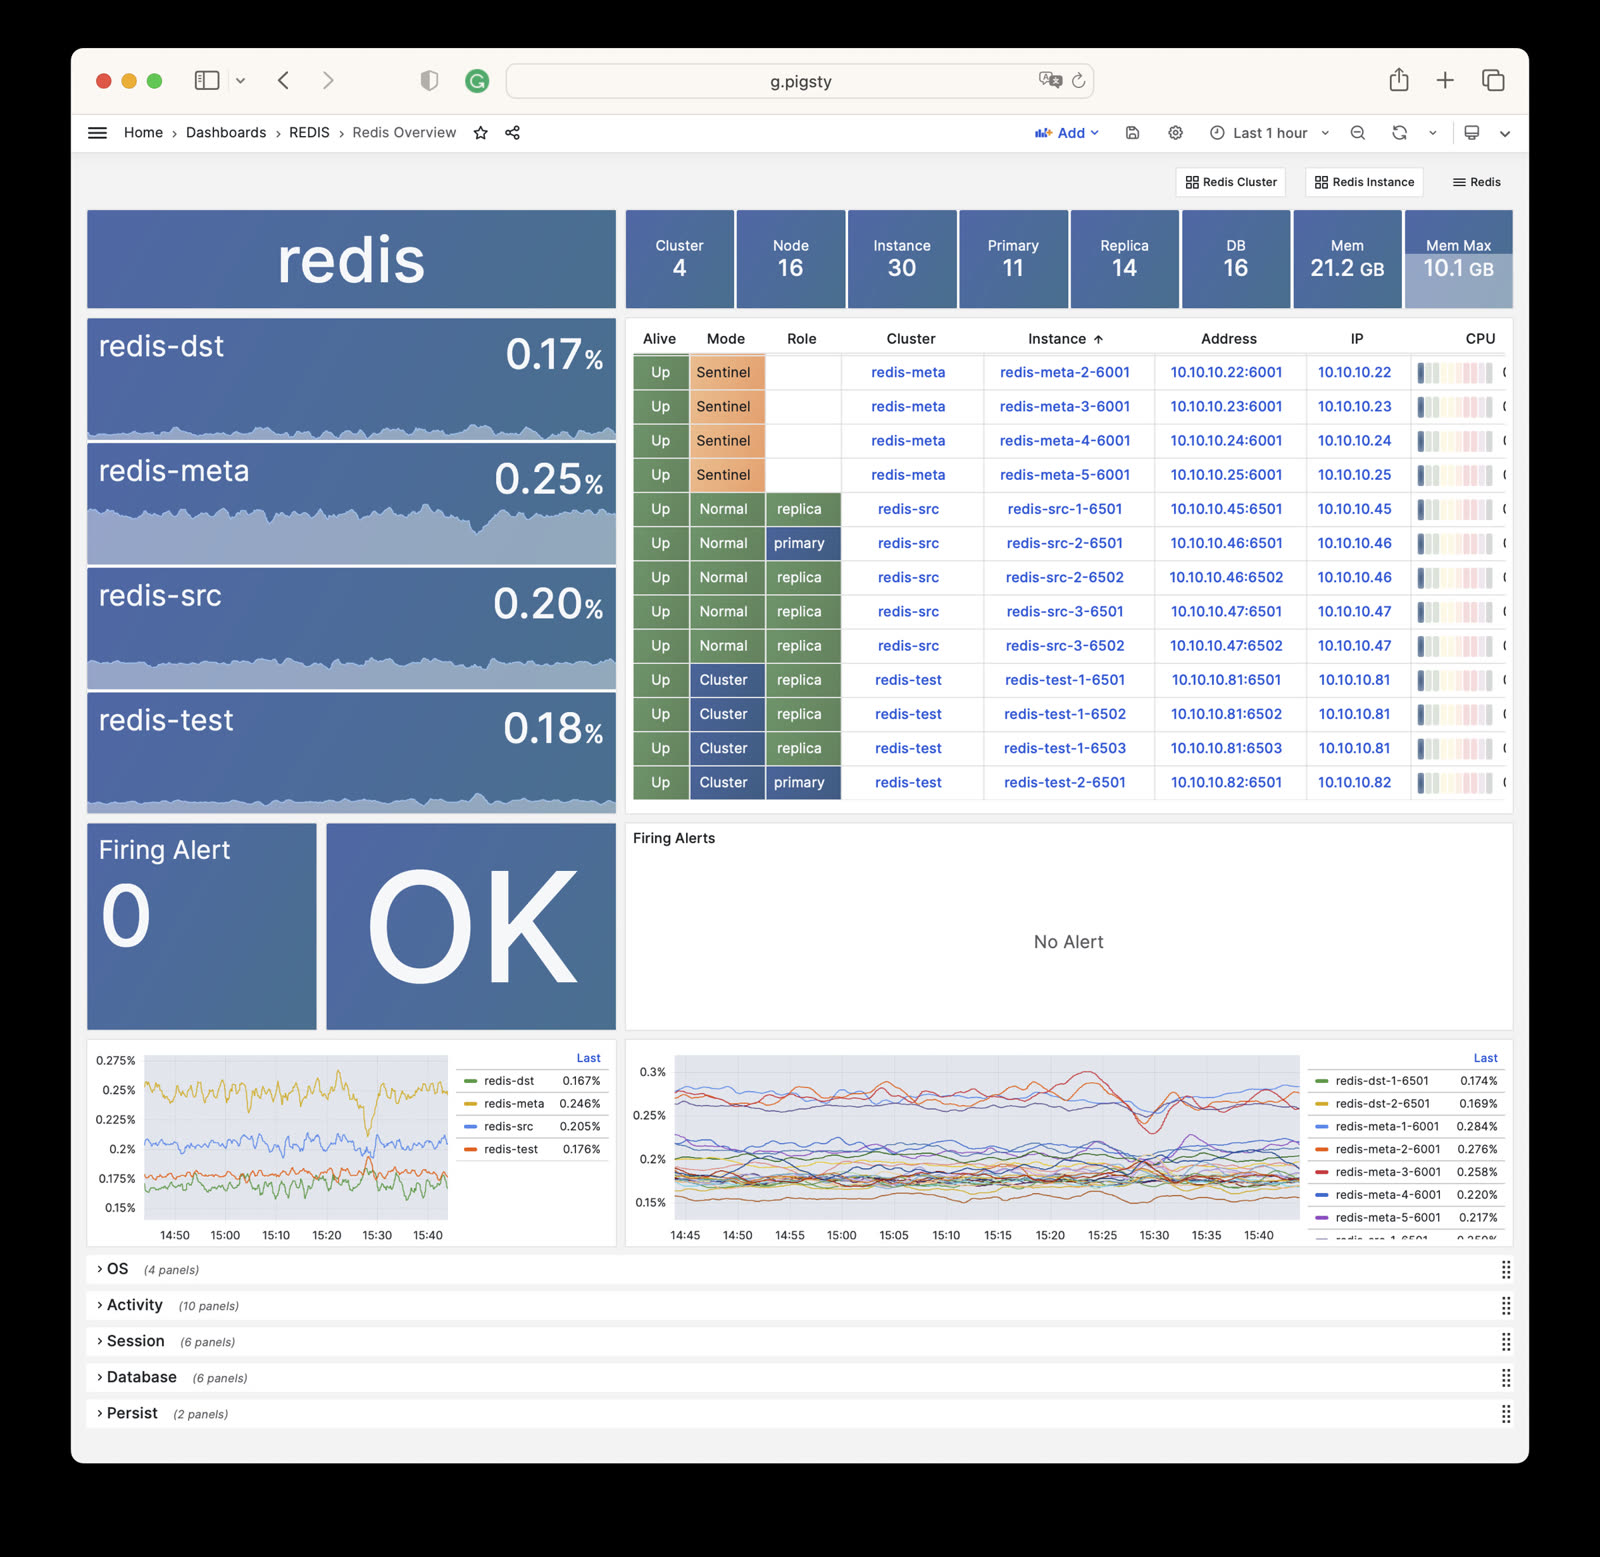
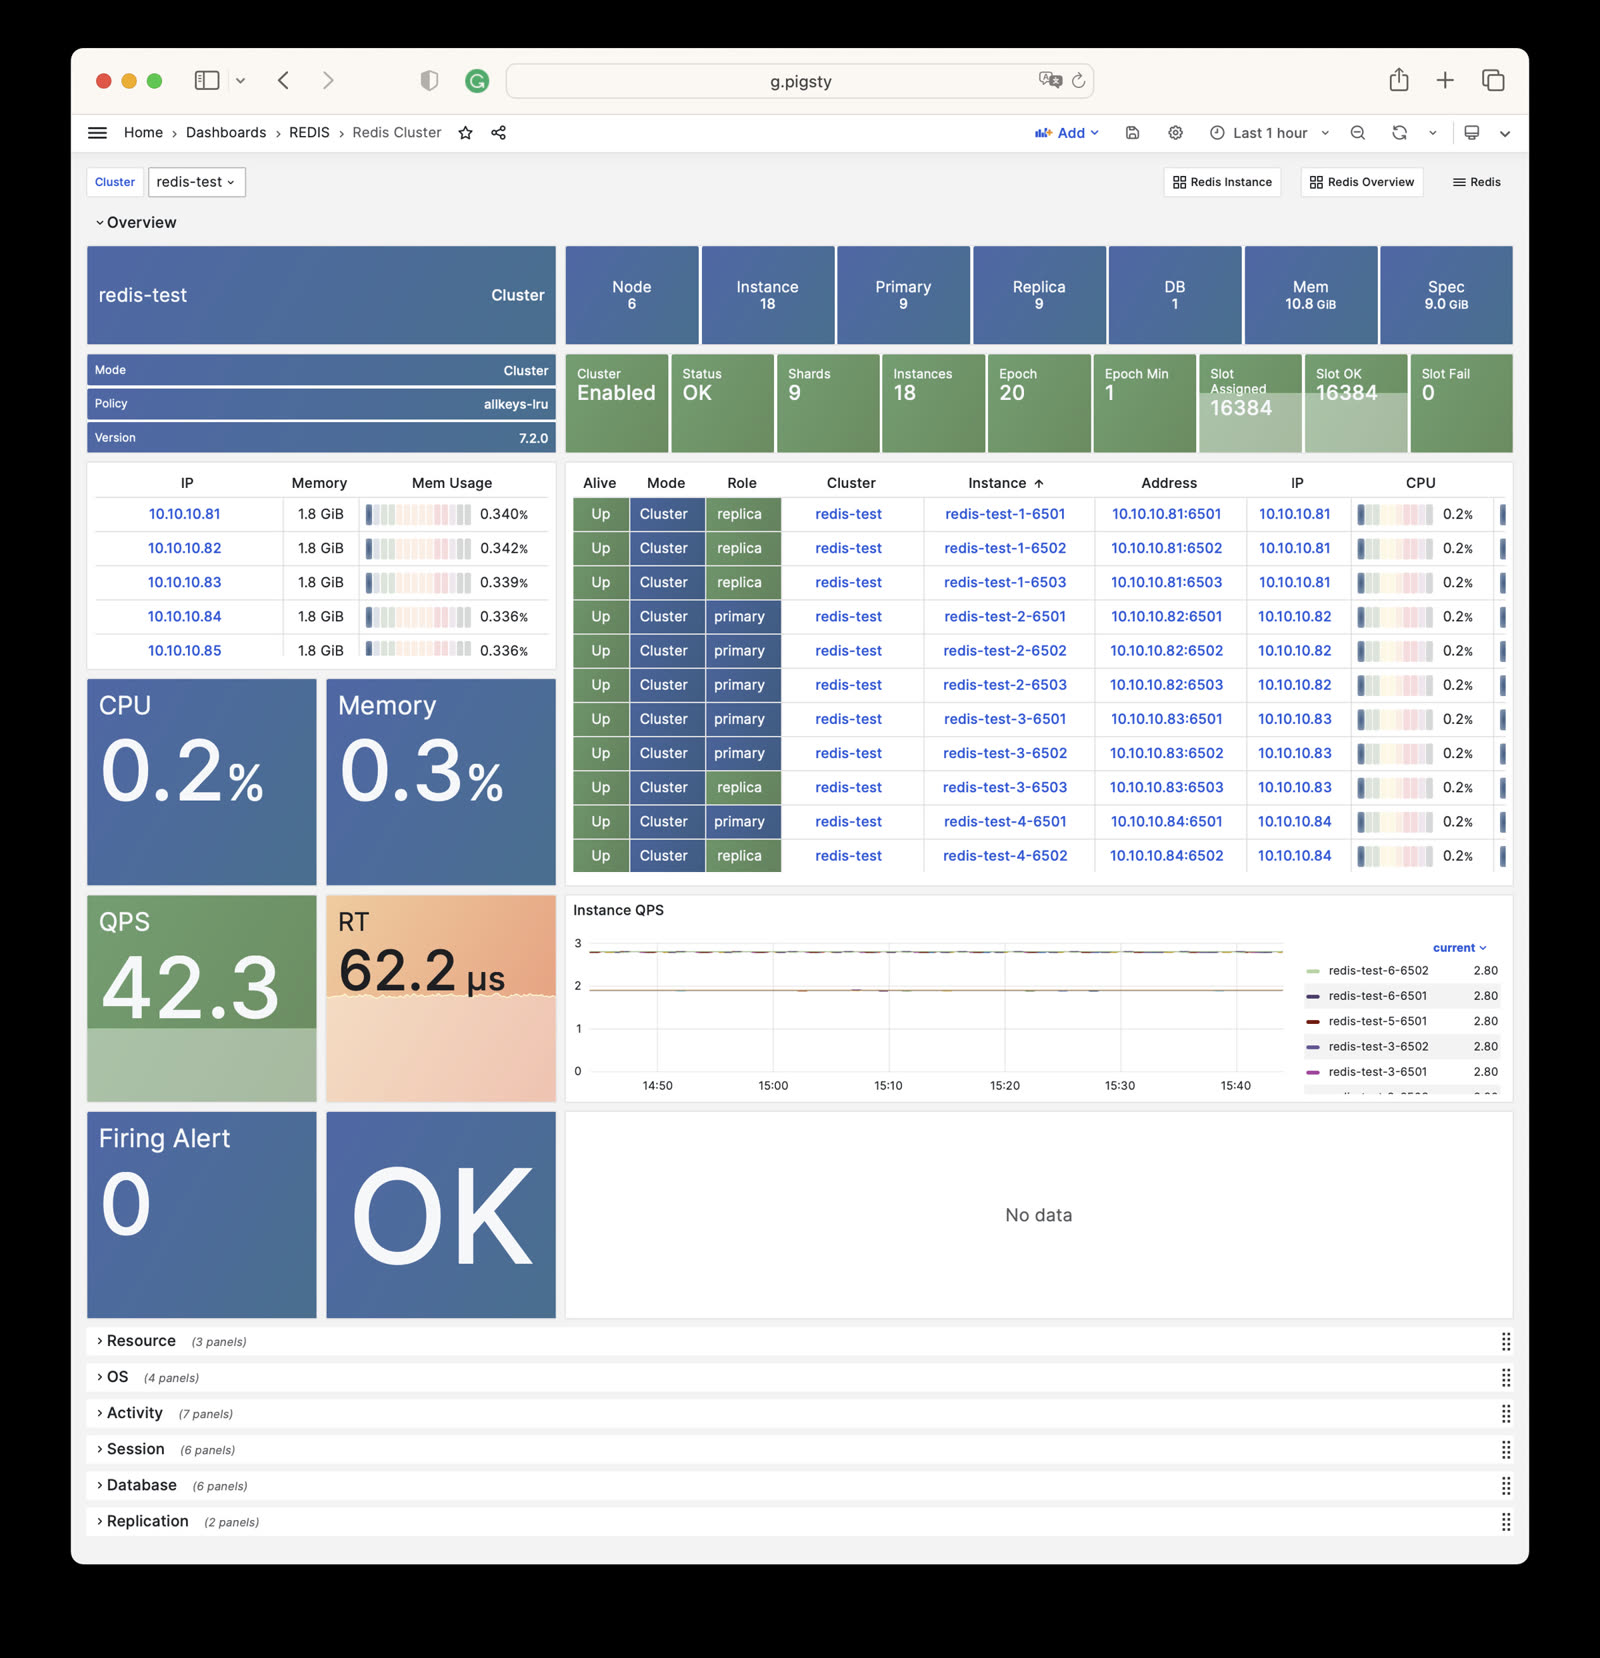
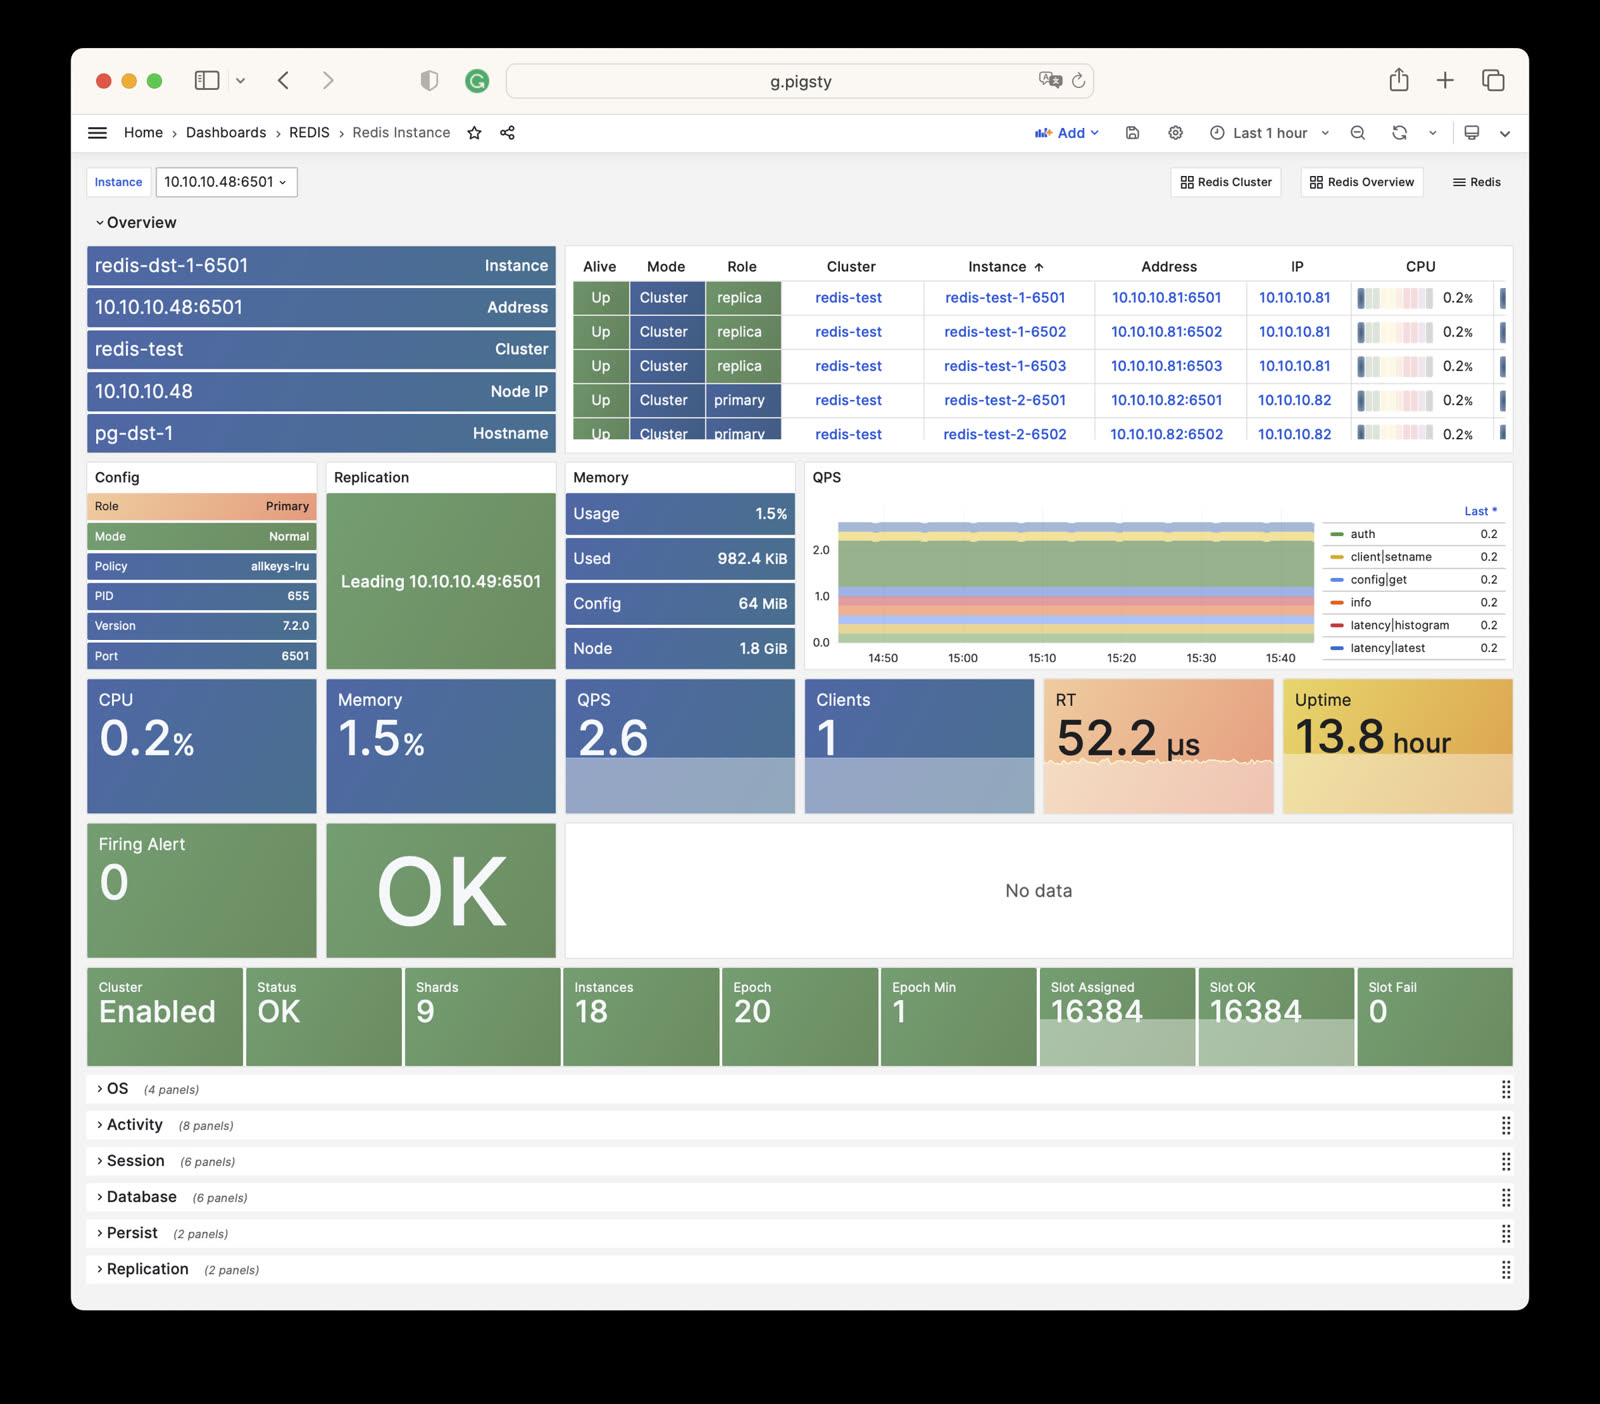
Redis Overview: Overview of all Redis clusters Redis Cluster: Details of a single Redis cluster Redis Instance: Details of a single Redis instance Monitoring Pigsty provides three monitoring dashboards for the REDIS
Redis Overview Redis Overview : Overview of all Redis clusters/instances
Redis Cluster Redis Cluster : Details of a single Redis cluster
Redis Cluster Dashboard Redis Instance Redis Instance : Details of a single Redis instance
Redis Instance Dashboard Alert Rules Pigsty provides the following six predefined alert rules for Redis, defined in files/victoria/rules/redis.yml
RedisDown: Redis instance is downRedisRejectConn: Redis instance rejecting connectionsRedisRTHigh: Redis instance response time is too highRedisCPUHigh: Redis instance CPU usage is too highRedisMemHigh: Redis instance memory usage is too highRedisQPSHigh: Redis instance QPS is too highThe rule expr defines the actual alert thresholds:
Response time: >160µs for 1 minute. CPU and memory usage: >70% for 1 minute. QPS: >32000 for 5 minutes. The excerpt below copies the current rule file exactly. Its CPU, memory, and QPS descriptions still show the old 60%, 80%, and 16000 thresholds. The RedisRTHigh comment incorrectly names pg:ins:query_rt. These comments do not change the actual expressions.
#==============================================================#
# Error #
#==============================================================#
# redis down triggers a P0 alert
- alert : RedisDown
expr : redis_up < 1
for : 1m
labels : { level : 0, severity : CRIT, category : redis }
annotations :
summary : "CRIT RedisDown: {{ $labels.ins }} {{ $labels.instance }} {{ $value }}"
description : |
redis_up[ins={{ $labels.ins }}, instance={{ $labels.instance }}] = {{ $value }} == 0
/ui/d/redis-instance?from=now-5m&to=now&var-ins={{$labels.ins}}
# redis reject connection in last 5m
- alert : RedisRejectConn
expr : redis:ins:conn_reject > 0
labels : { level : 0, severity : CRIT, category : redis }
annotations :
summary : "CRIT RedisRejectConn: {{ $labels.ins }} {{ $labels.instance }} {{ $value }}"
description : |
redis:ins:conn_reject[cls={{ $labels.cls }}, ins={{ $labels.ins }}][5m] = {{ $value }} > 0
/ui/d/redis-instance?from=now-10m&to=now&viewPanel=88&fullscreen&var-ins={{ $labels.ins }}
#==============================================================#
# Latency #
#==============================================================#
# redis avg query response time > 160 µs
- alert : RedisRTHigh
expr : redis:ins:rt > 0.00016
for : 1m
labels : { level : 1, severity : WARN, category : redis }
annotations :
summary : "WARN RedisRTHigh: {{ $labels.cls }} {{ $labels.ins }}"
description : |
pg:ins:query_rt[cls={{ $labels.cls }}, ins={{ $labels.ins }}] = {{ $value }} > 160µs
/ui/d/redis-instance?from=now-10m&to=now&viewPanel=97&fullscreen&var-ins={{ $labels.ins }}
#==============================================================#
# Saturation #
#==============================================================#
# redis cpu usage more than 70% for 1m
- alert : RedisCPUHigh
expr : redis:ins:cpu_usage > 0.70
for : 1m
labels : { level : 1, severity : WARN, category : redis }
annotations :
summary : "WARN RedisCPUHigh: {{ $labels.cls }} {{ $labels.ins }}"
description : |
redis:ins:cpu_all[cls={{ $labels.cls }}, ins={{ $labels.ins }}] = {{ $value }} > 60%
/ui/d/redis-instance?from=now-10m&to=now&viewPanel=43&fullscreen&var-ins={{ $labels.ins }}
# redis mem usage more than 70% for 1m
- alert : RedisMemHigh
expr : redis:ins:mem_usage > 0.70
for : 1m
labels : { level : 1, severity : WARN, category : redis }
annotations :
summary : "WARN RedisMemHigh: {{ $labels.cls }} {{ $labels.ins }}"
description : |
redis:ins:mem_usage[cls={{ $labels.cls }}, ins={{ $labels.ins }}] = {{ $value }} > 80%
/ui/d/redis-instance?from=now-10m&to=now&viewPanel=7&fullscreen&var-ins={{ $labels.ins }}
#==============================================================#
# Traffic #
#==============================================================#
# redis qps more than 32000 for 5m
- alert : RedisQPSHigh
expr : redis:ins:qps > 32000
for : 5m
labels : { level : 2, severity : INFO, category : redis }
annotations :
summary : "INFO RedisQPSHigh: {{ $labels.cls }} {{ $labels.ins }}"
description : |
redis:ins:qps[cls={{ $labels.cls }}, ins={{ $labels.ins }}] = {{ $value }} > 16000
/ui/d/redis-instance?from=now-10m&to=now&viewPanel=96&fullscreen&var-ins={{ $labels.ins }} Was this page helpful?
Yes
No
Thanks—your feedback helps us improve this page.
What got in the way? (optional)
Missing information
Incorrect or outdated
Steps did not work
Hard to understand
Change response